
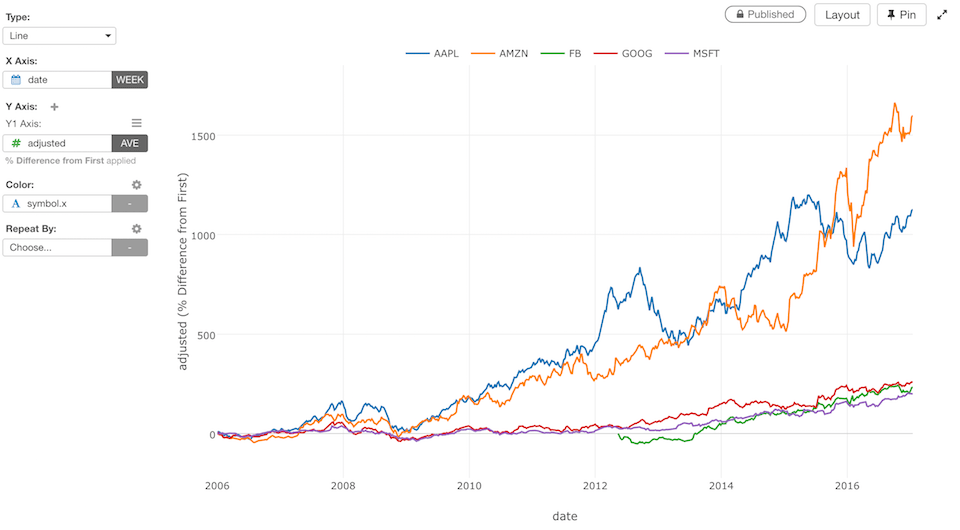
Column Assignments
- X-Axis - Assign a column you want to show at X-Axis. If it’s a Date / Time column assigned, you can select the aggregation level such as
Month,Week,Day, etc. If you assign a Number column, you can choose eitherAs Numberto treat values as continuous values orAs Textto treat values as categorical values. - Y-Axis - Assign a column you want to show at Y-Axis. If it’s a Numeric column assigned, you can set the aggregation function such as
Sum,Mean (Average), etc. to aggregate the values. You can also assign a Window Calculation from the Y-Axis properties. Look at Window Calculation section for details. - Color - Take a look at Color section for more details.
- Sort - Assign a column to use for Sorting the X-Axis values. The default is based on either the alphabetic order or the factor level order for Factor type columns.
- Repeat By - You can assign a column to repeat the chart for each of its values. Take a look at Repeat By section for more details.
Marker Type
You can select one of marker types from theMarker menu of Y-Axis properties. Take a look at Marker Type section for more details.