
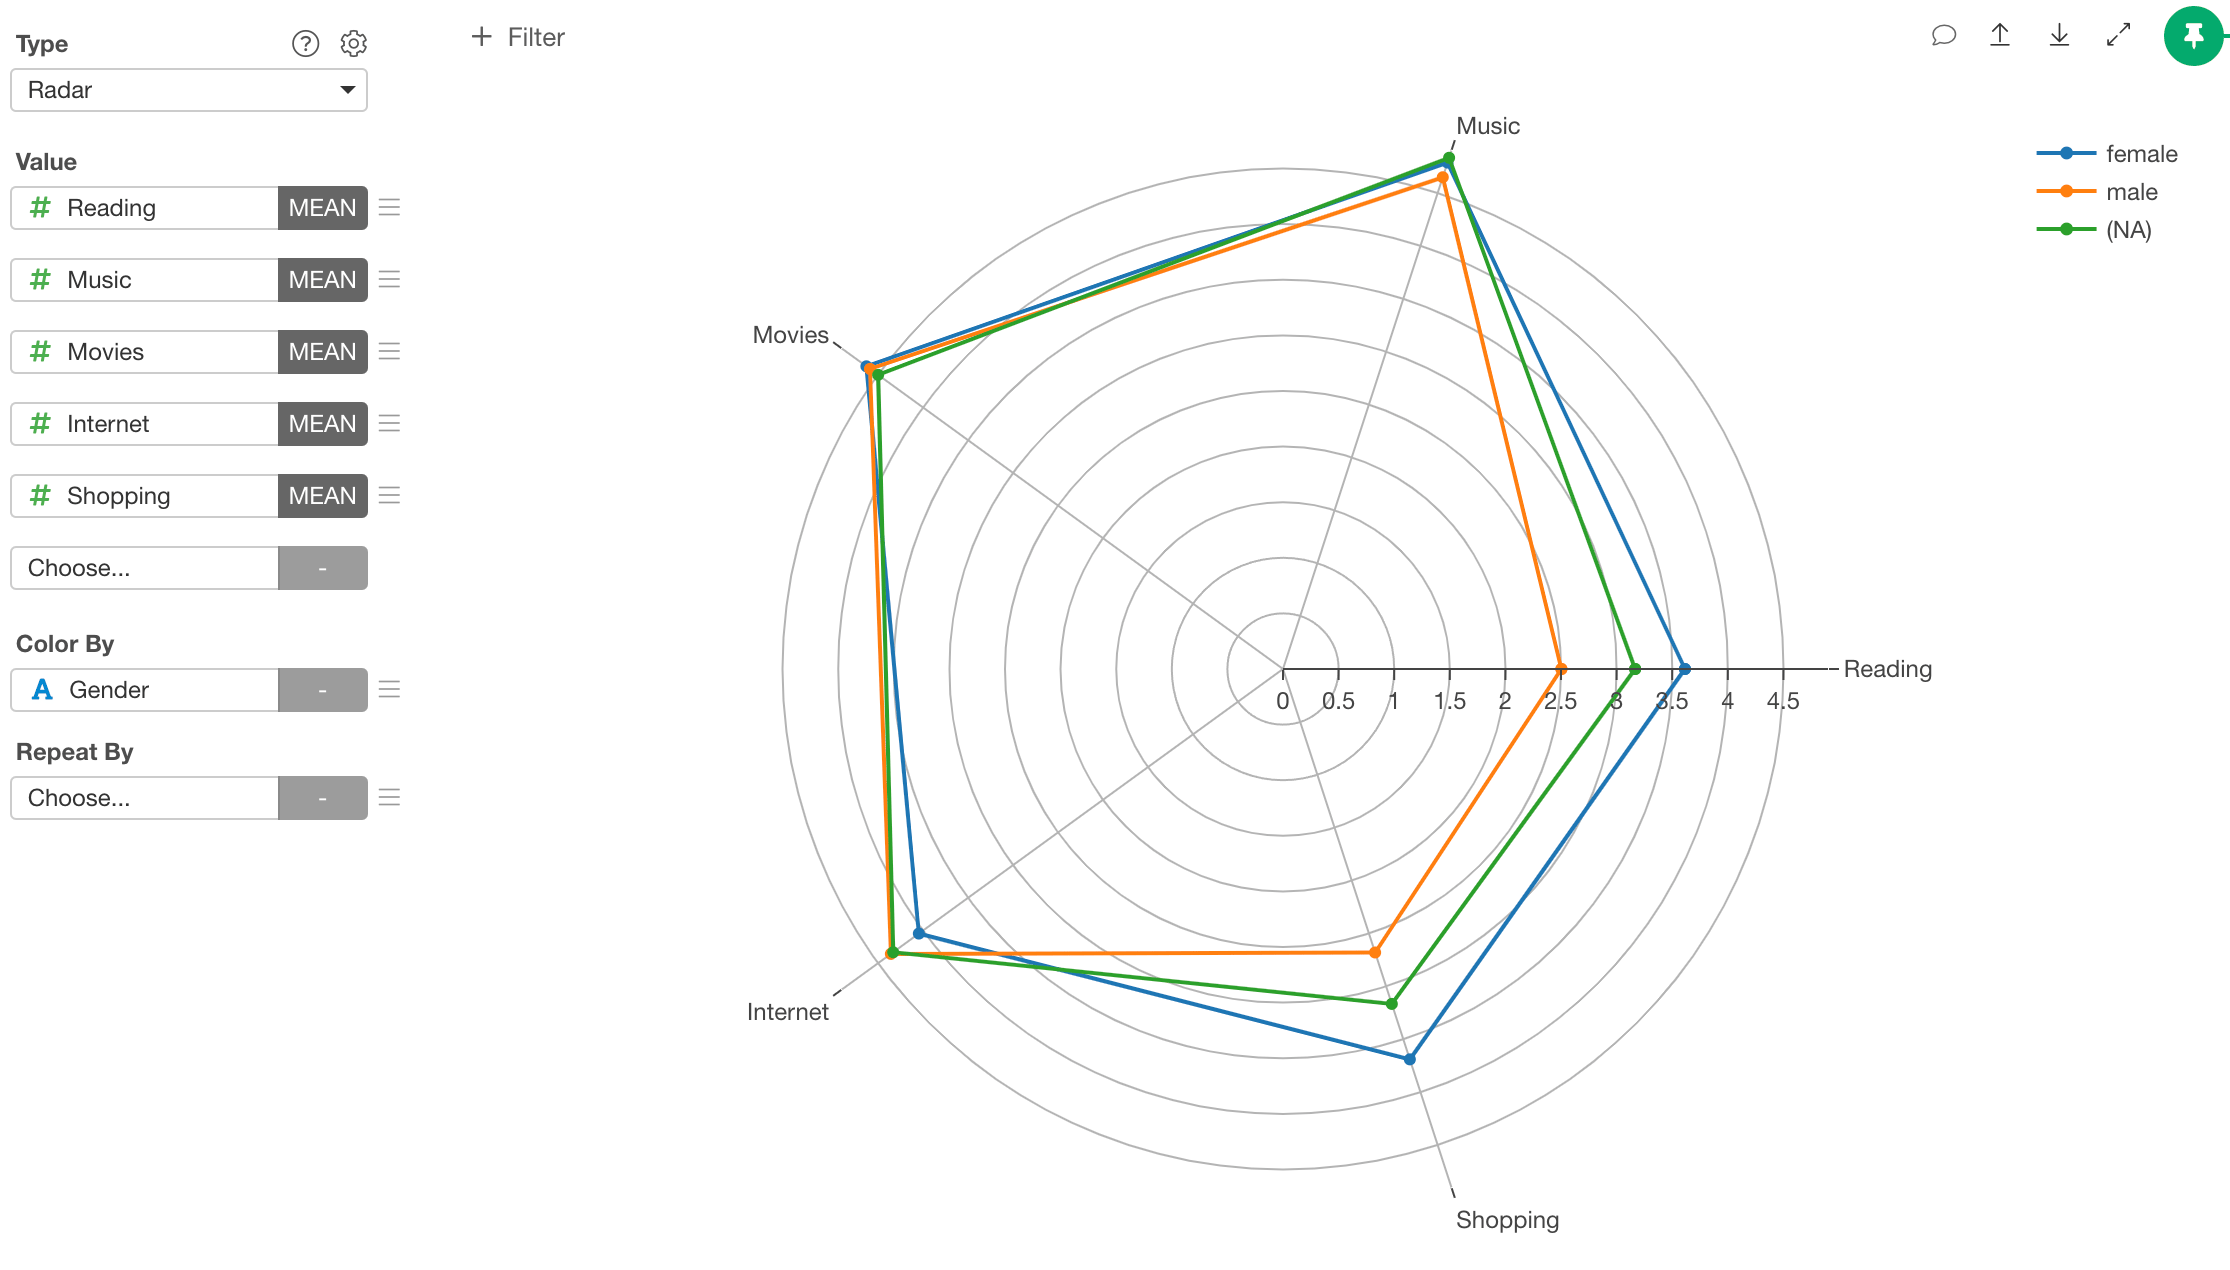
Column Assignments
- Value - Assign columns containing values that you want to show on the radar. You need at least 3 columns to render a Radar chart. You can assign any type of columns. You need to assign an aggregation function to calculate a value that represents each column.
- Color By - You can draw radars for each of its values. Take a look at Color section for more details.
- Repeat By - You can assign a column to repeat the chart for each of its values. Take a look at Repeat By section for more details.
Category
You can categorize numeric values inside the chart. See Category(Binning) for the detail.Start Position
You can set the starting point of the radar. The following options are available.- Top (Default)
- Bottom
- Left
- Right