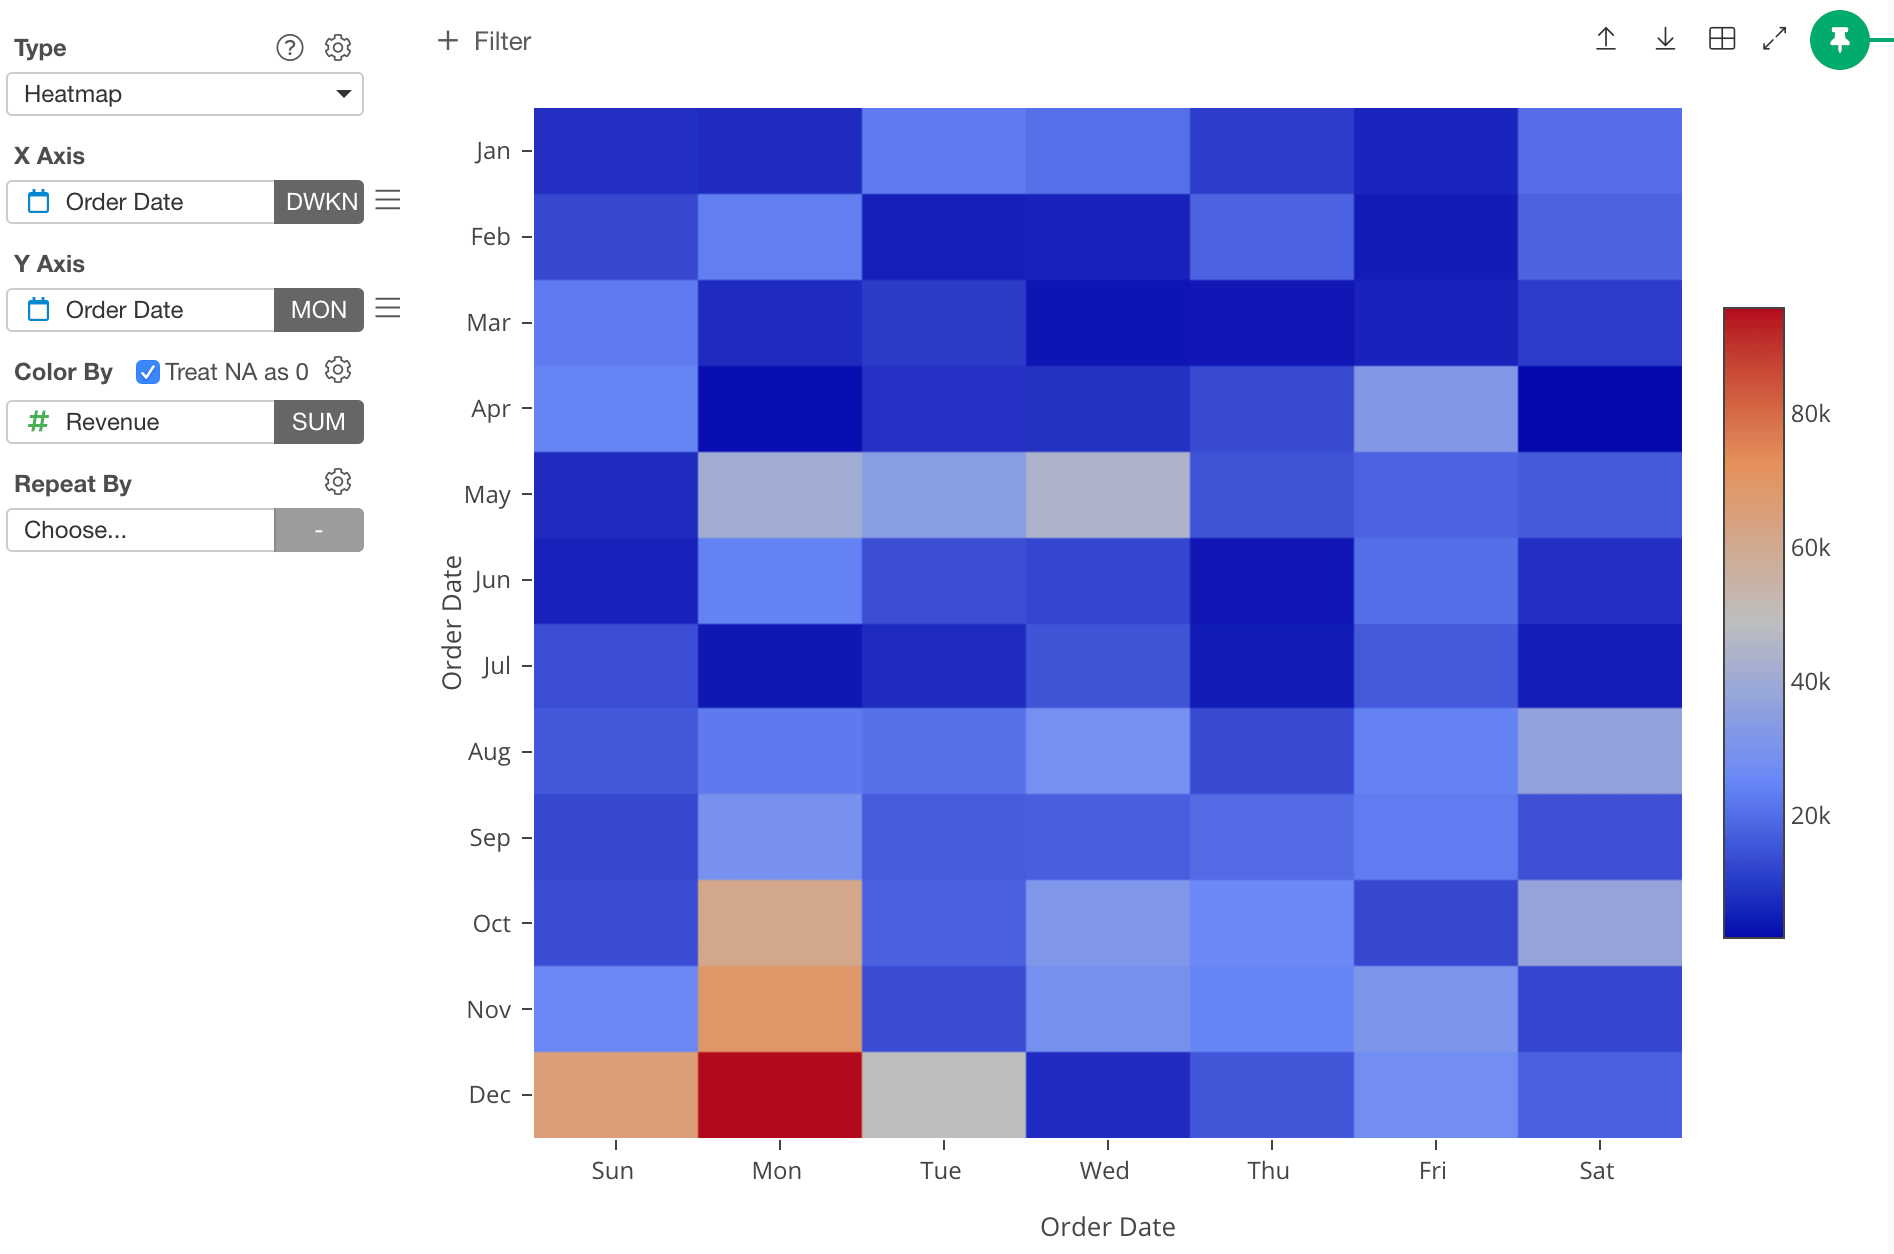
Column Assignments
- X-Axis - Assign a column you want to show at X-Axis. You can assign any column with discrete values (text or number column). If it’s a Date / Time column assigned, you can select the aggregation level such as
Month,Week,Day, etc. - Y-Axis - Assign a column you want to show at Y-Axis. You can assign any column with discrete values (text or number column). If it’s a Date / Time column assigned, you can select the aggregation level such as
Month,Week,Day, etc. - Color - Take a look at Color section for more details.
- Repeat By - You can assign a column to repeat the chart for each of its values. Take a look at Repeat By section for more details.
Show Values on Plot
You can show the column values at “Color By” on the plot area by checking the “Show Value on Plot” checkbox.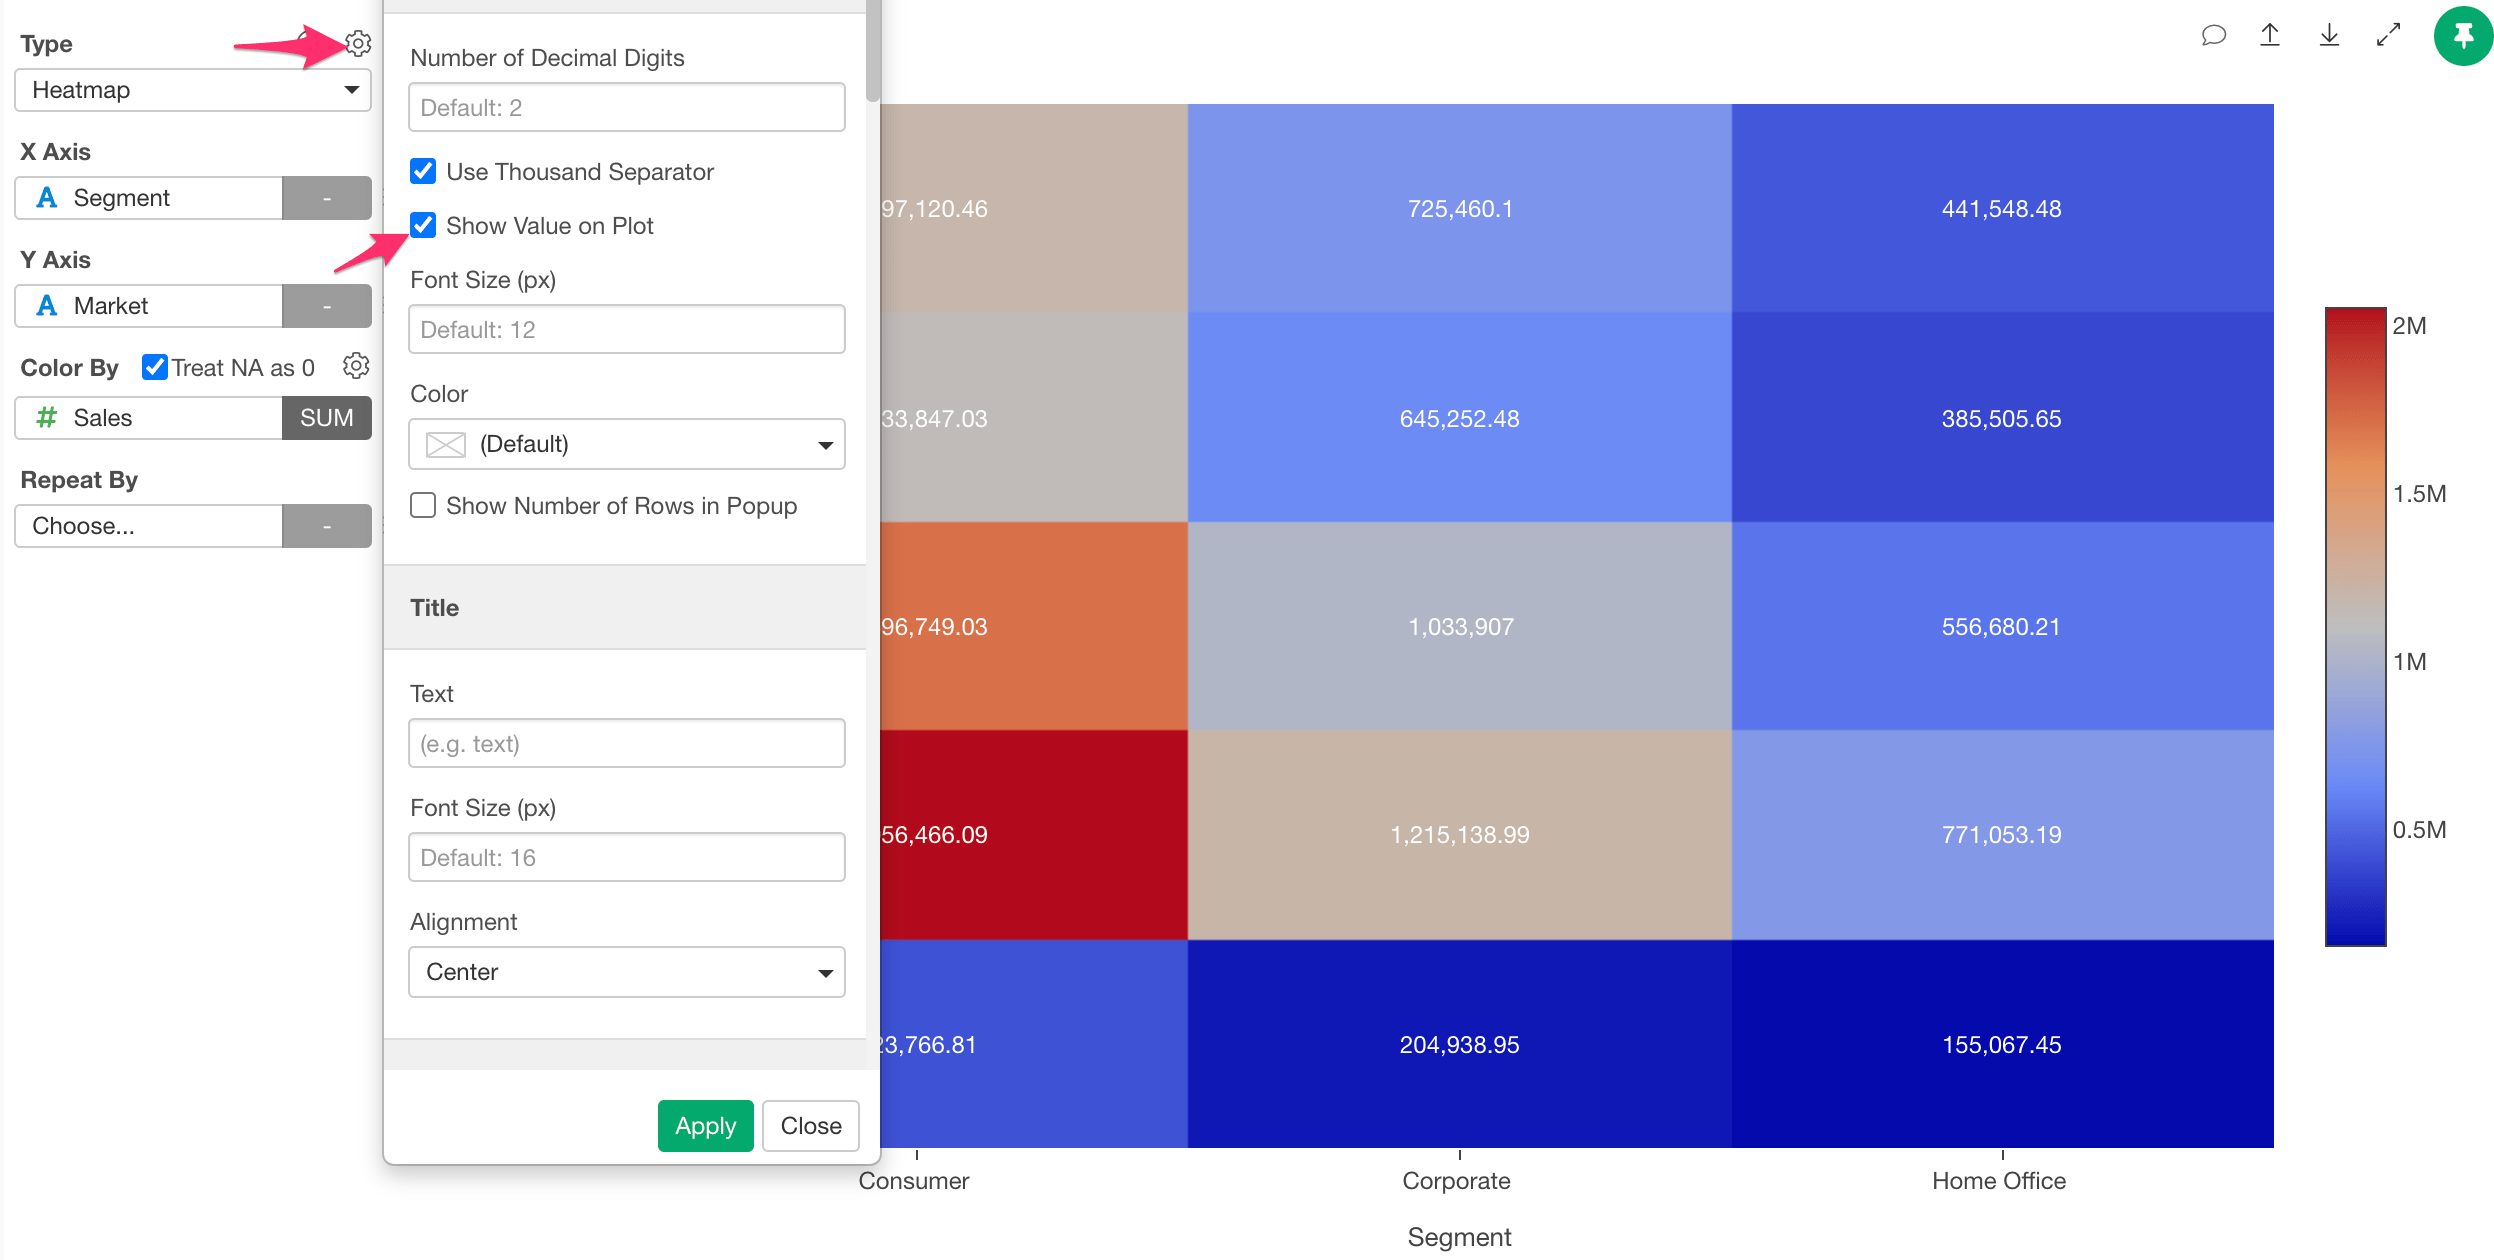
Category
You can categorize numeric values inside the chart. See Category(Binning) for the detail.‘Others’ Group
If you have many categories, you can reduce the number of categories by changing some category names to ‘Others’ using the ‘Others’ Group feature. See ‘Others’ Group for the detail.Custom Function
You can use the Custom Function feature to define your own aggregation function. See Custom Function for the detail.Layout Configuration
Take a look at Layout Configuration on how to configure the layout and format.Exporting Chart Data
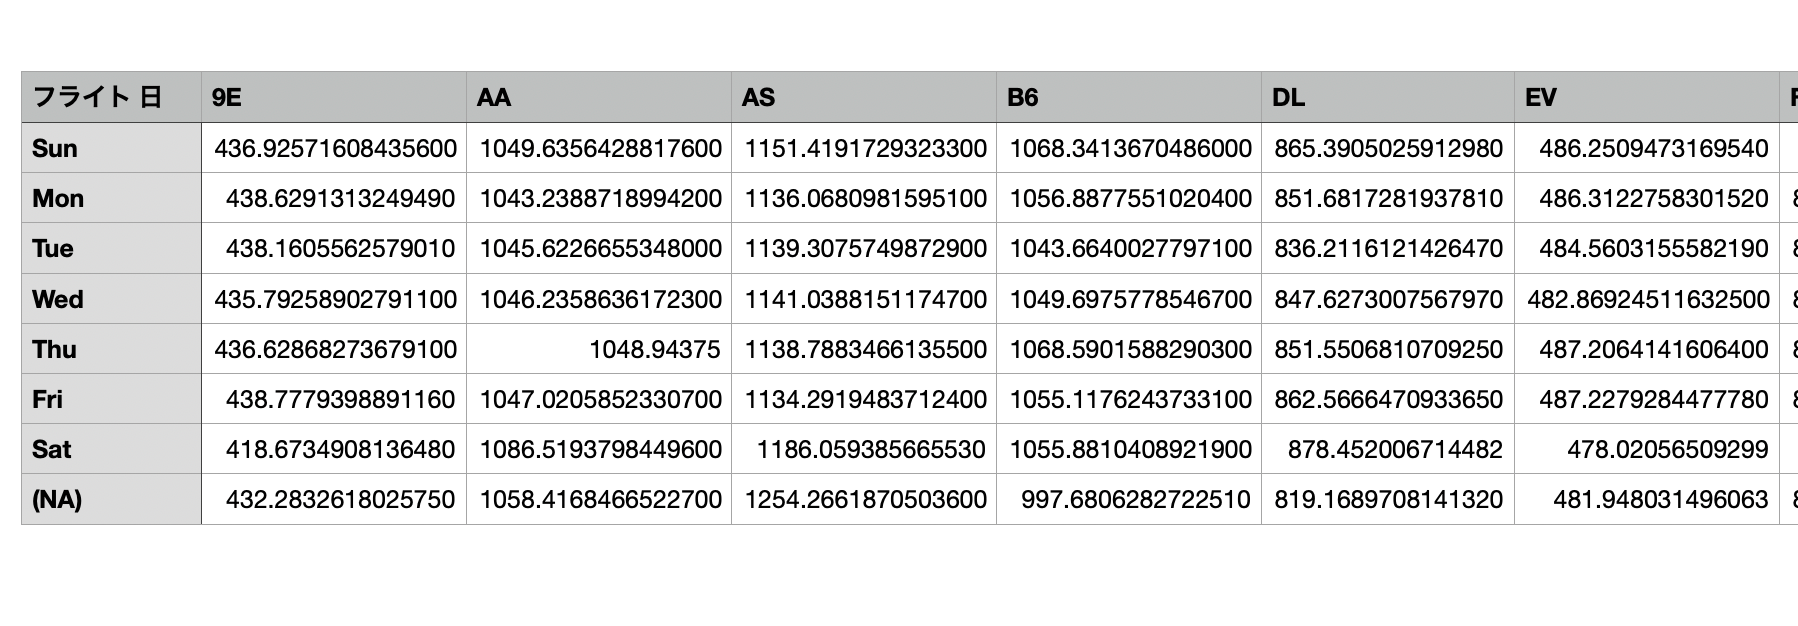
Unlike the other chart types, if you export the Heatmap chart data, the data will be saved in in a wide format.