
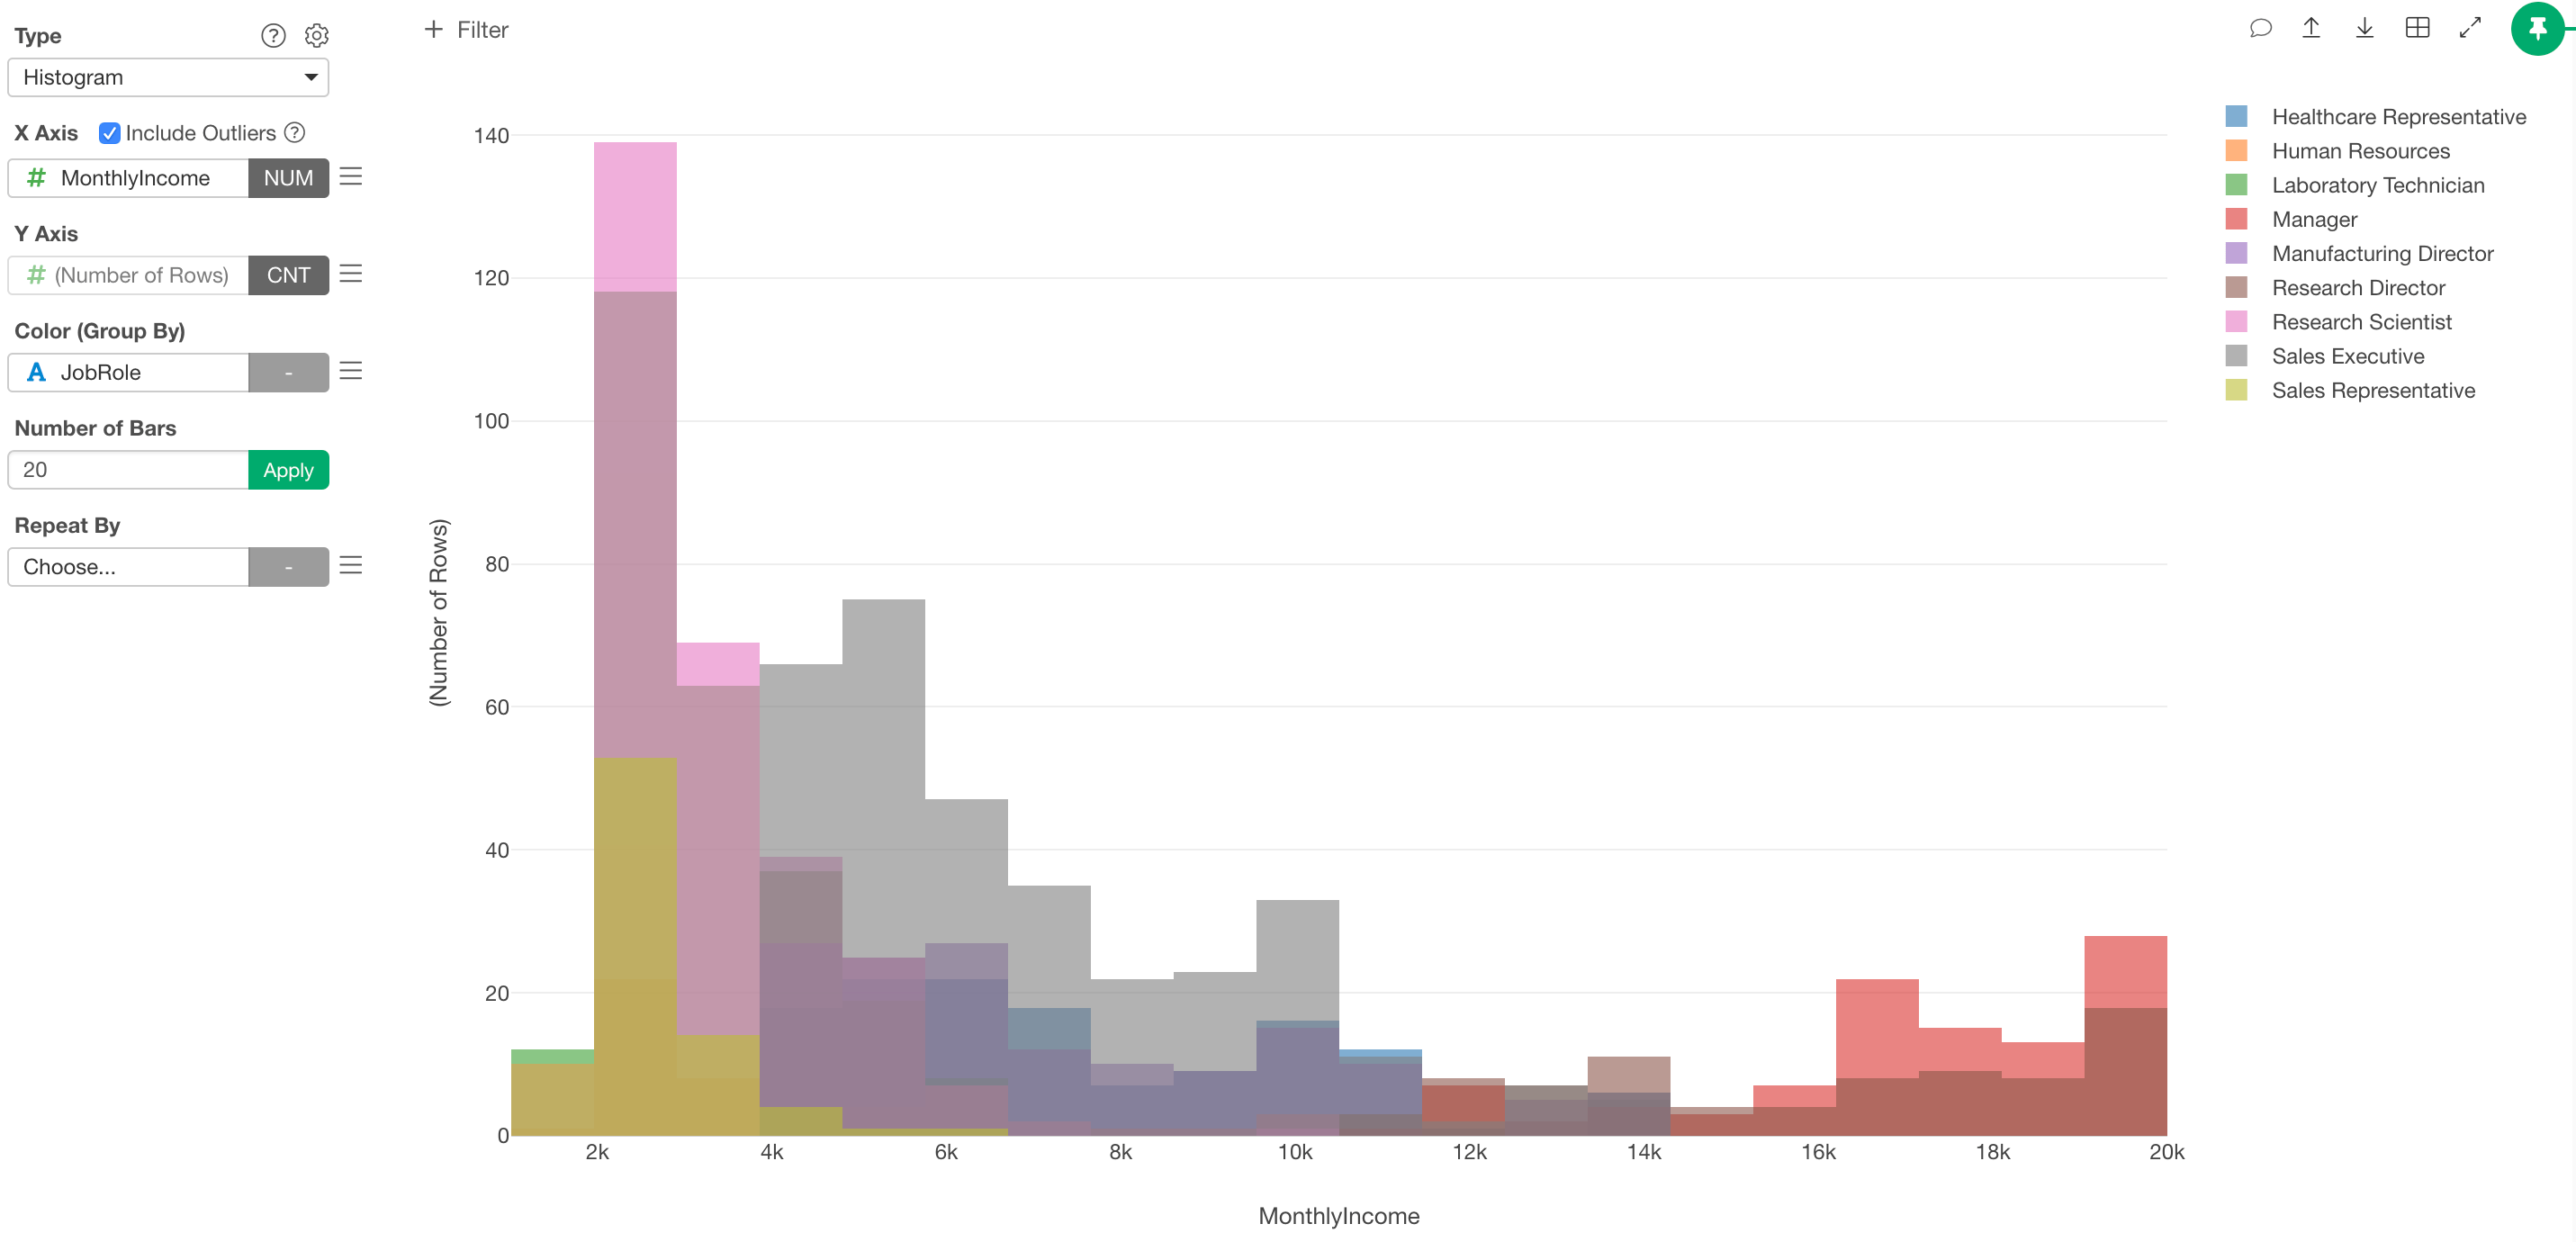
Column Assignments
- X-Axis - Assign a column you want to show its distribution. You can assign only a number based column here.
- Y-Axis - It is fixed to “Number of Rows”. You can select how you want to show the bars at the function dropdown. See
["Ratio Mode"](#ratio-mode) for detail. - Color - Take a look at Color section for more details.
- Number of Bars - Specify the number of bars. The default is
Automatic. - Repeat By - You can assign a column to repeat the chart for each of its values. Take a look at Repeat By section for more details.
Count/Ratio Mode
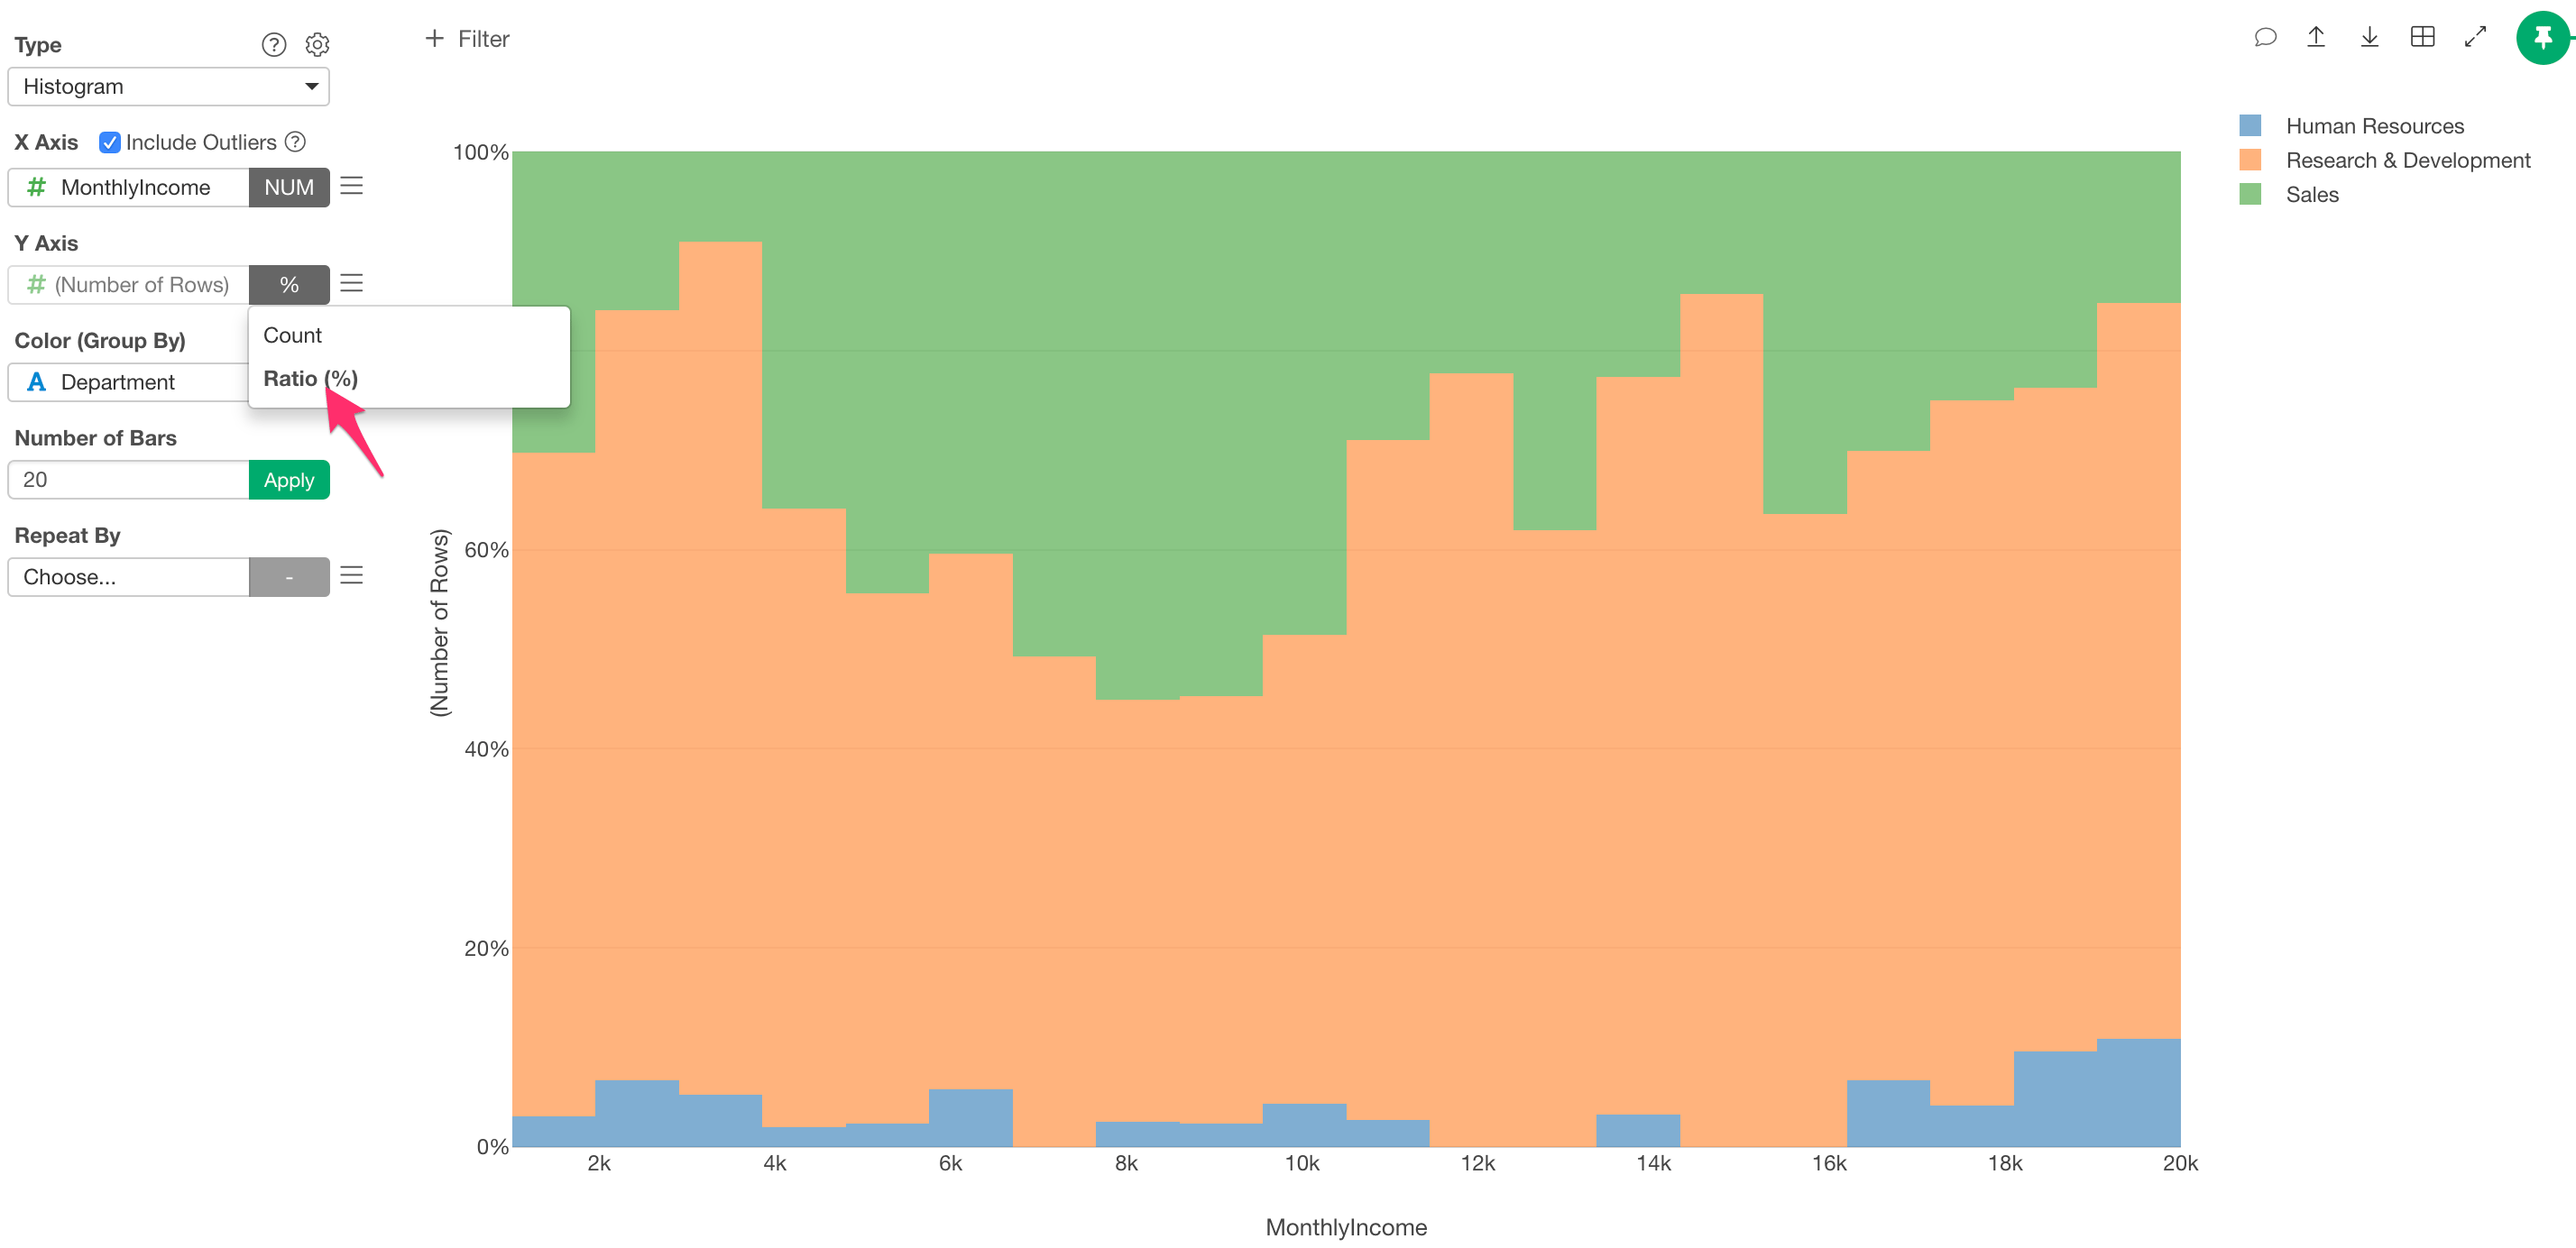
You can select how to show the histogram bars at the function dropdown of Y-Axis control. The following options are available.- Count - Each bar represents a count of the bucket. This is the default mode.
- Ratio (%) - Show the bars in ratio (%). You need to assign a column to Color.
Cumulative Sum Reference Line
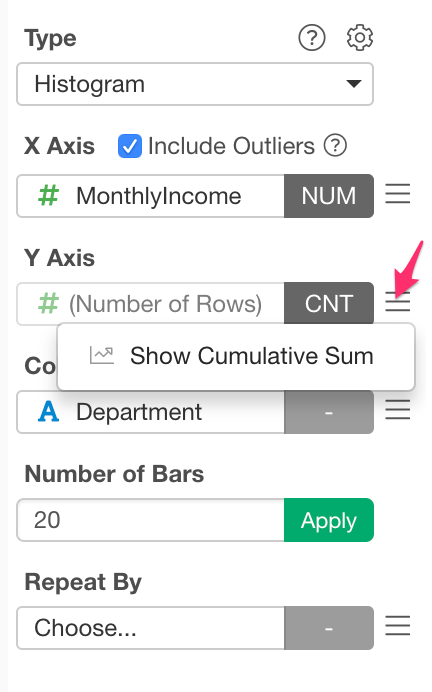
You can show the cumulative sum reference lines.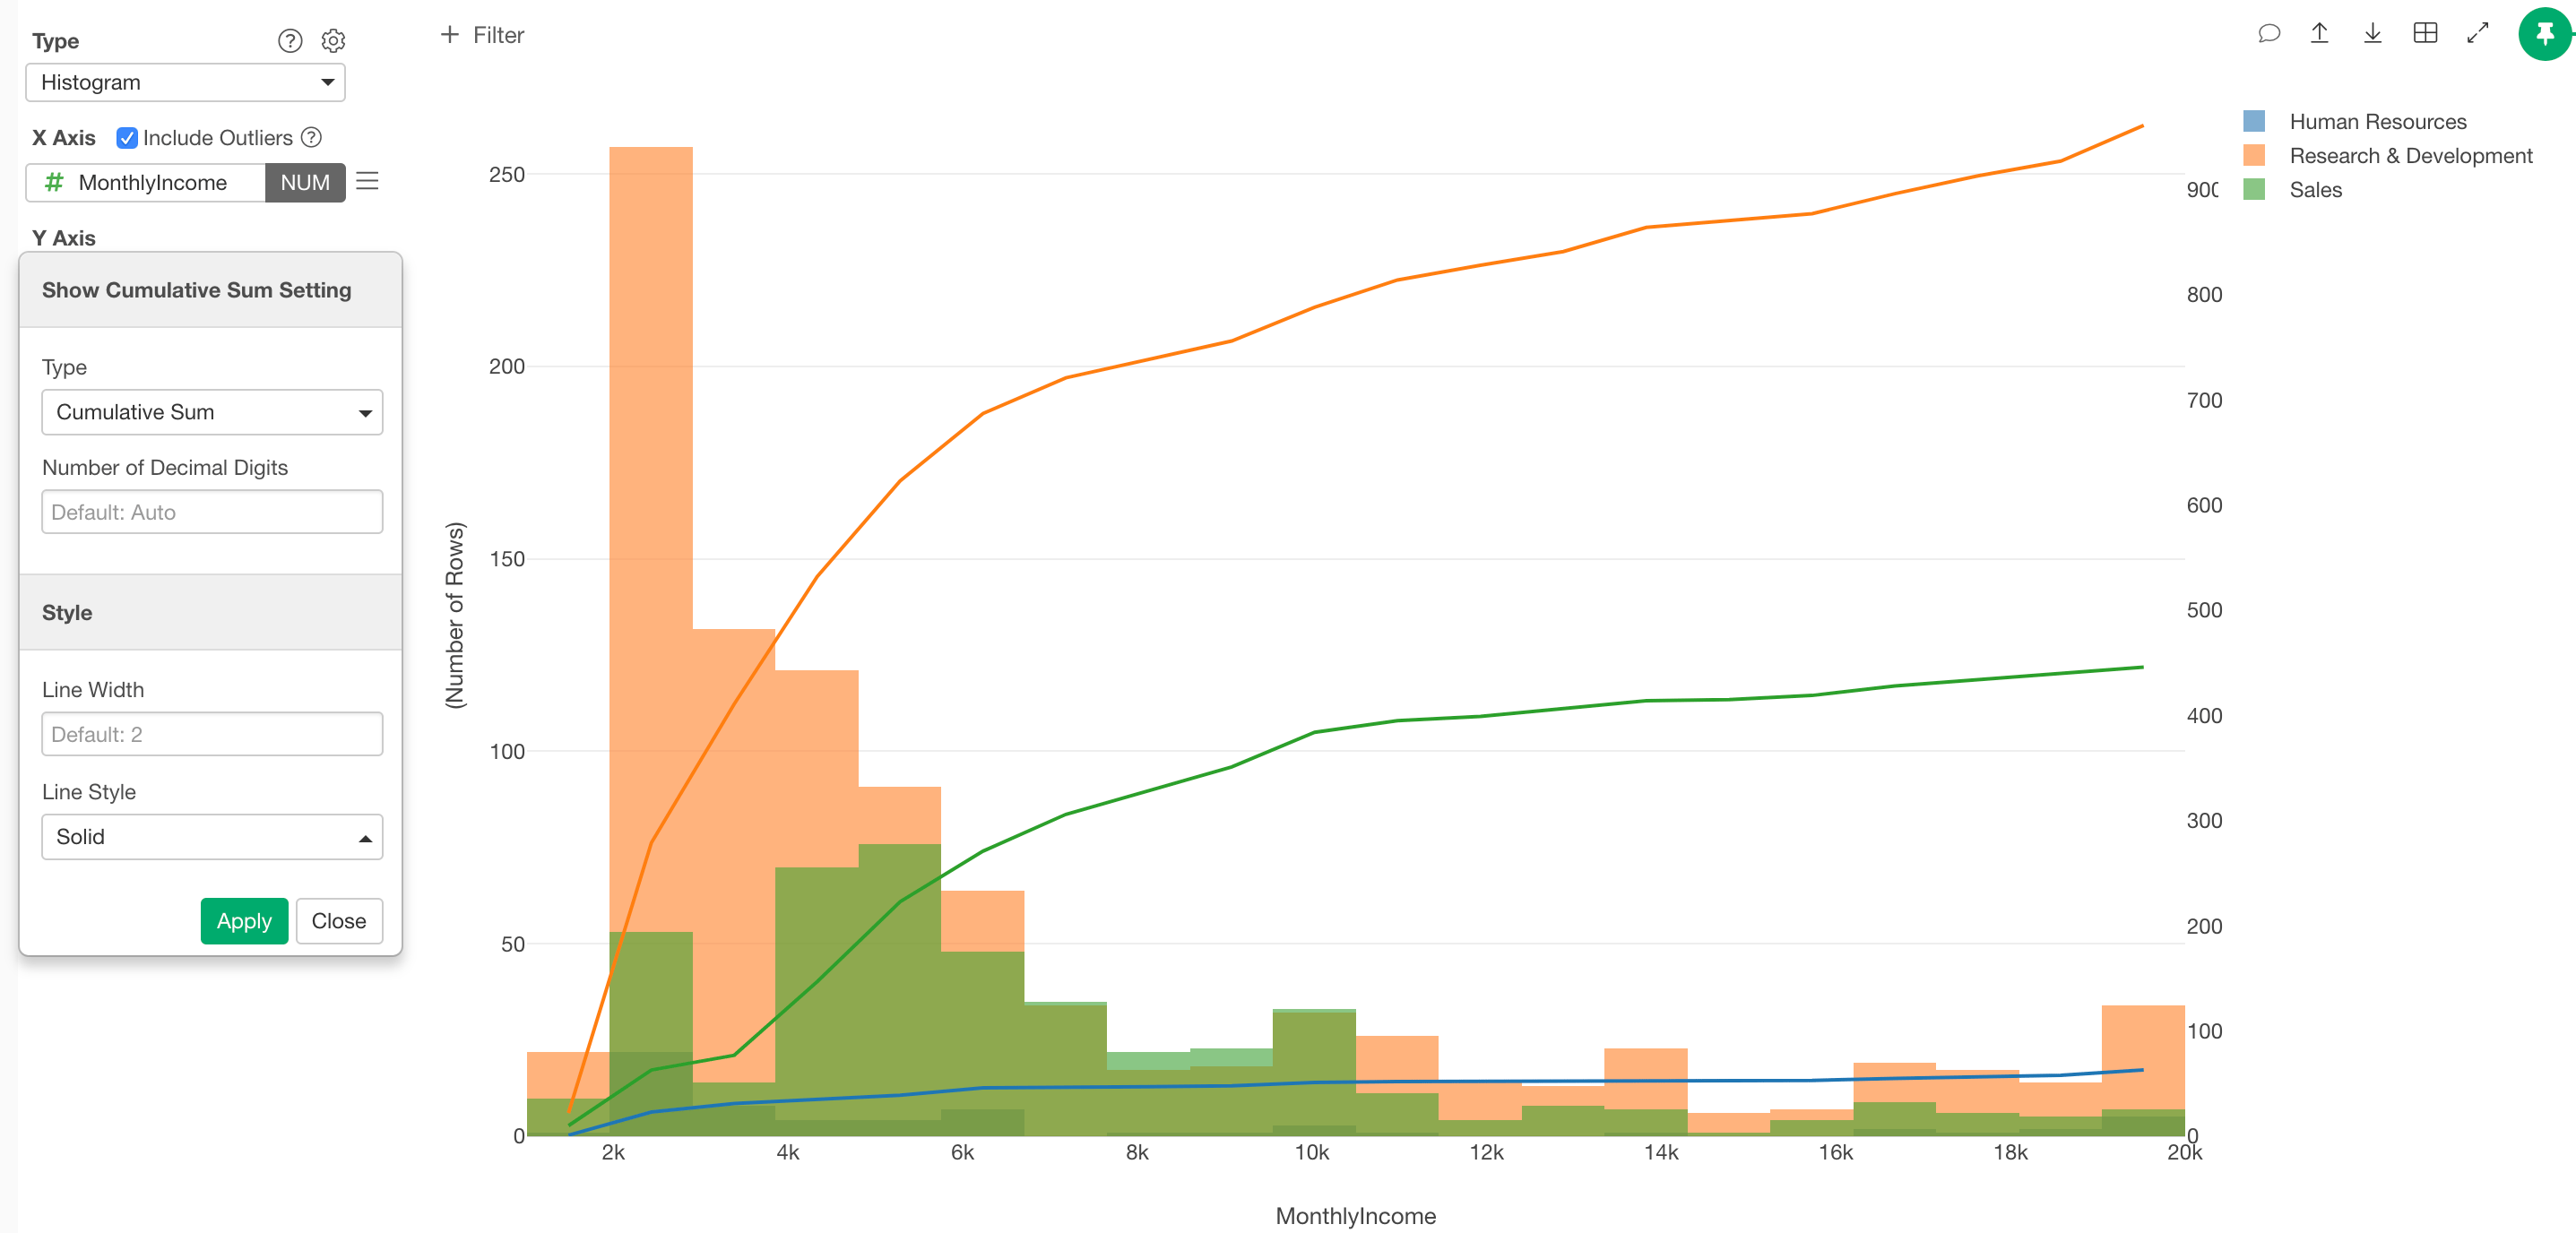
- Type
- Cumulative Sum - Cumulative sum of bars.
- Cumulative Sum Ratio (%) - Ratio of the cumulative sum values against the total value. Lines start from 0% and end with 100%.
- Number of Decimal Digits - Number of decimal digits for the cumulative sum lines.
- Line Width: Thickless of the line.
- Line Style
- Solid
- Dotted
- Dot and Dash