
- Bar
- Line
- Area
- Pie / Ring
- Histogram
- Density Plot
- Boxplot
- Violin Plot
- Error bar
- Error Bar (Summarized Data)
- Map - Long/Lat
- Pivot Table
- Summarize Table
Show Unused Factor Levels
You can set to show or hide the unused factor levels.Missing Value Hanling
Type
You can set how to fill the missing value at the “Missing Value Handling” option. This option is available in the following chart types.- Bar - Y-Axis
- Line - Y-Axis
- Area - Y-Axis
- Scatter (With Aggregation) - Y-Axis
- Pivot Table - Value
- Summarize Table - Value
- None
- Fill with NA
- Fill with Zero
- Fill with Previous Value First, then Next Value (Only available in Pivot Table and Summarize Table)
- Fill with Previous Value
- Fill with Next Value
- Fill with Next Value First, then Previous Value (Only available in Pivot Table and Summarize Table)
None
No filling happens. If you use a Line chart, It just connects the values. This is the default behavior.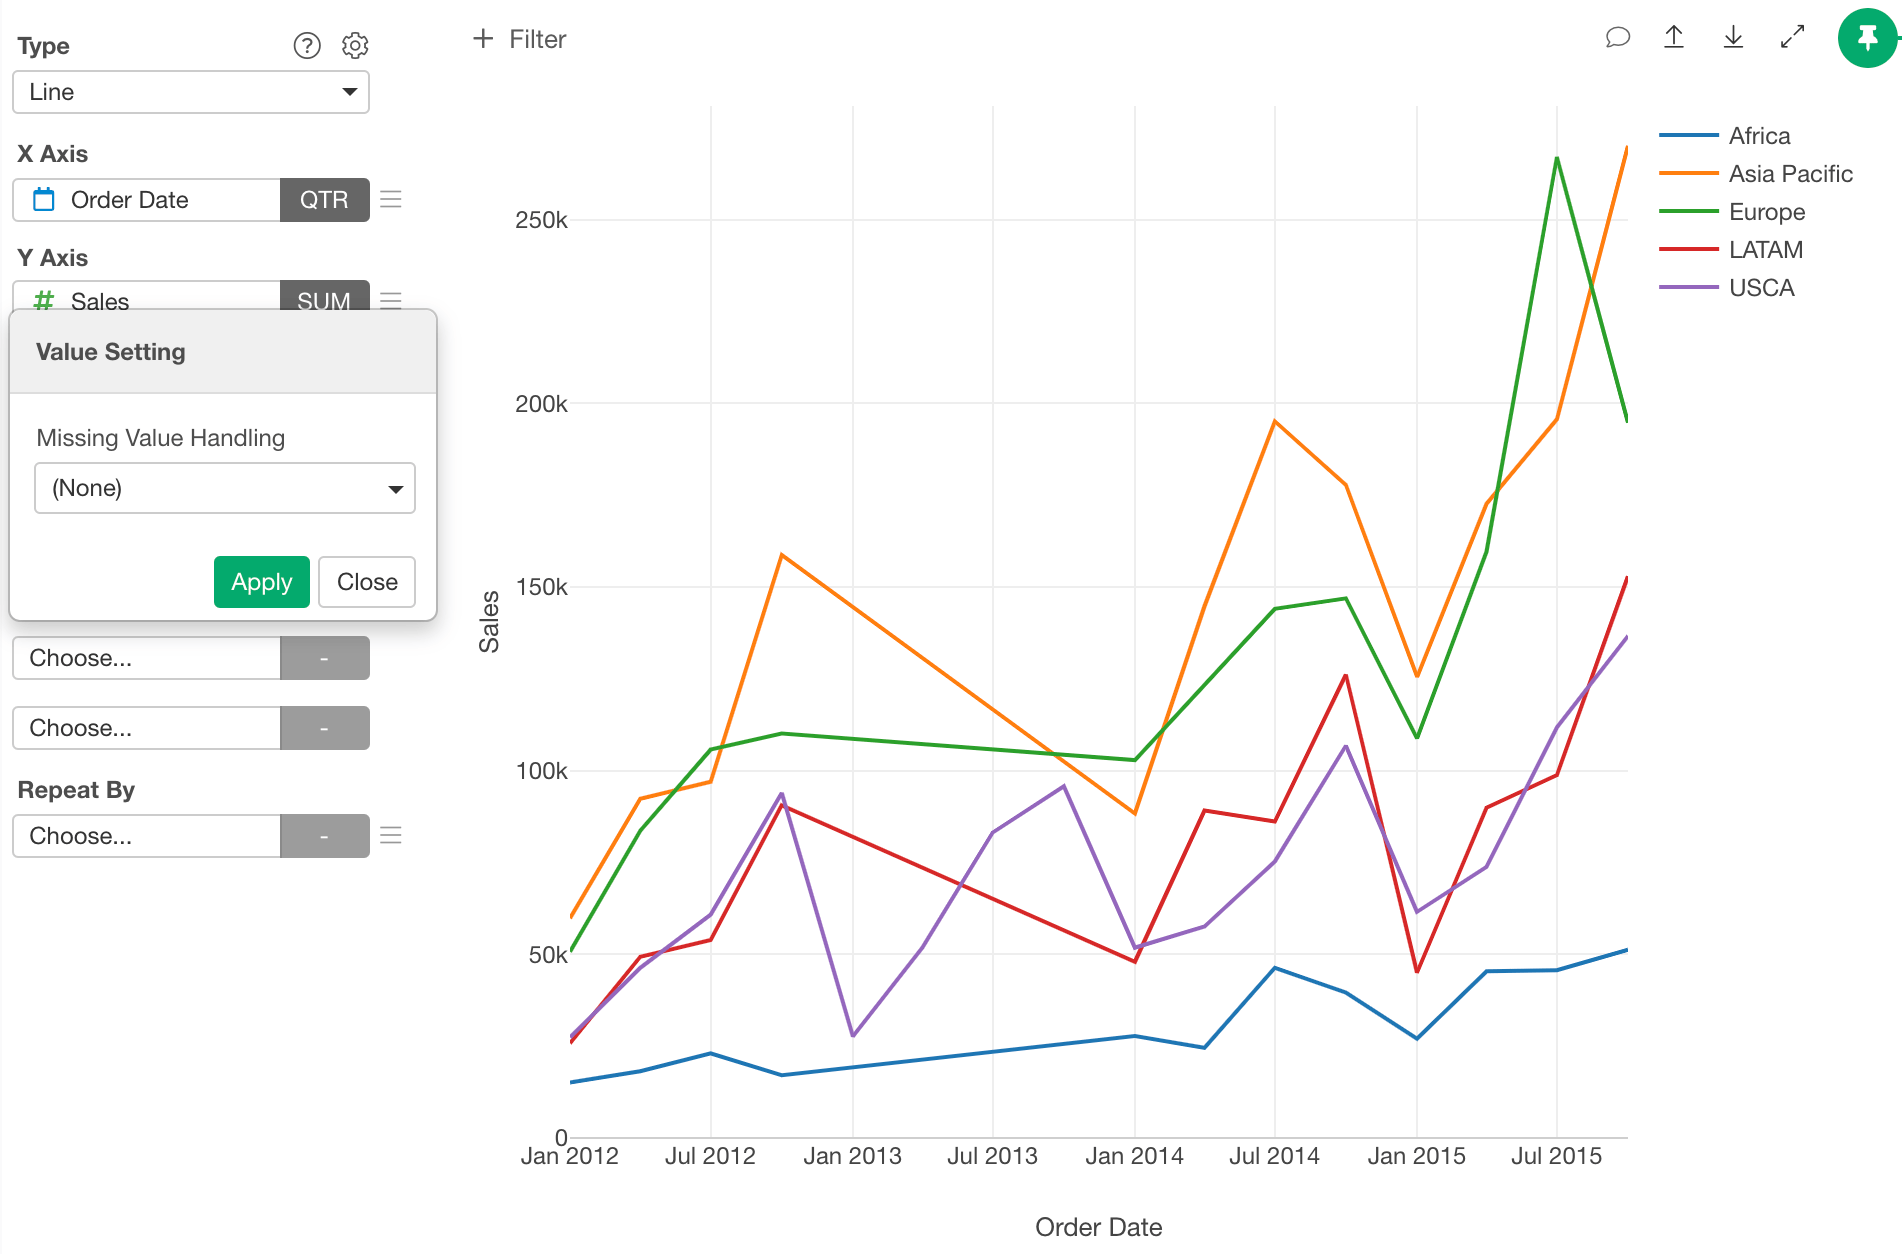
Fill with NA
It fills missing values with NAs. If you use a Line chart, lines will be intermittent.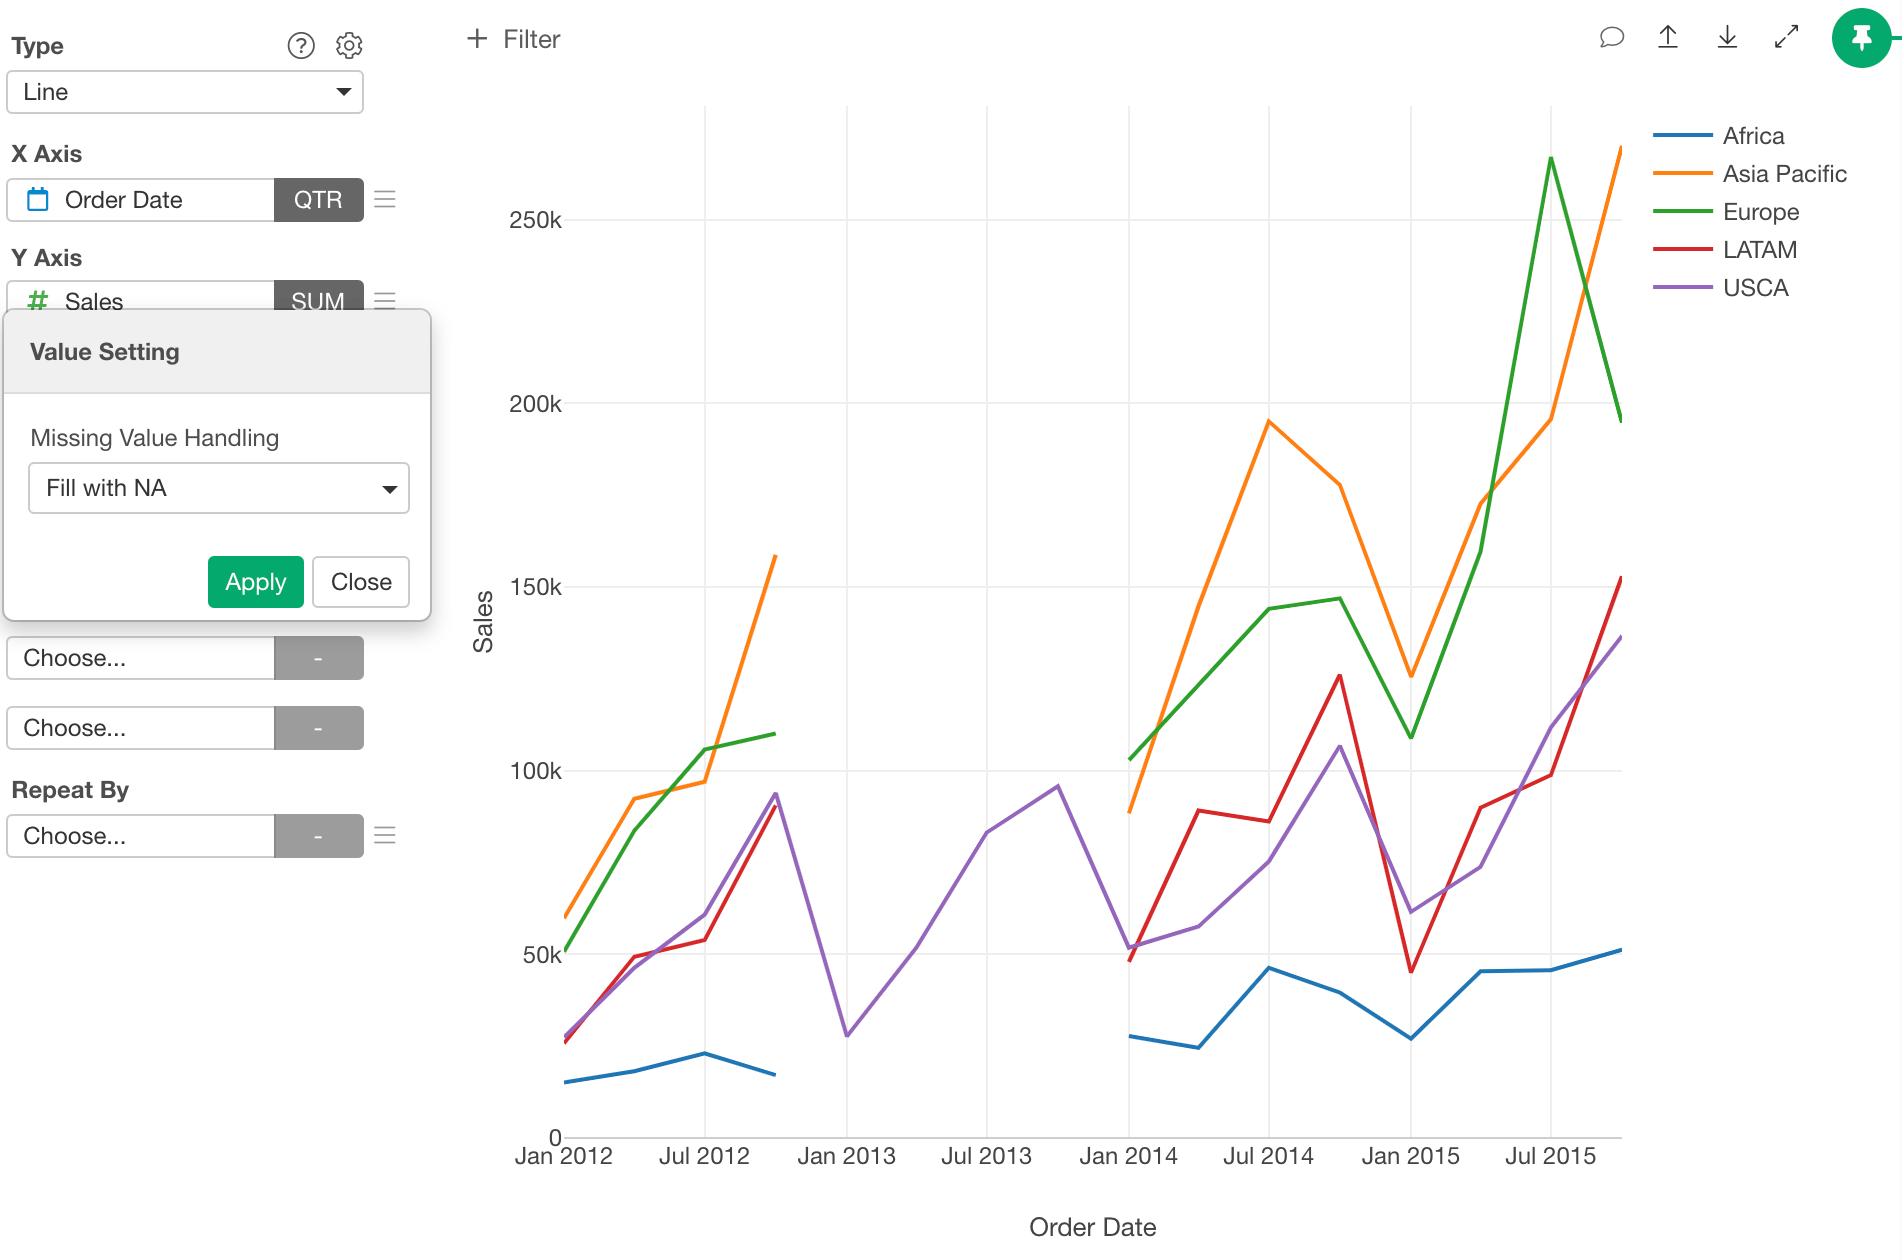
Fill with Zero
It fills missing values with zeros.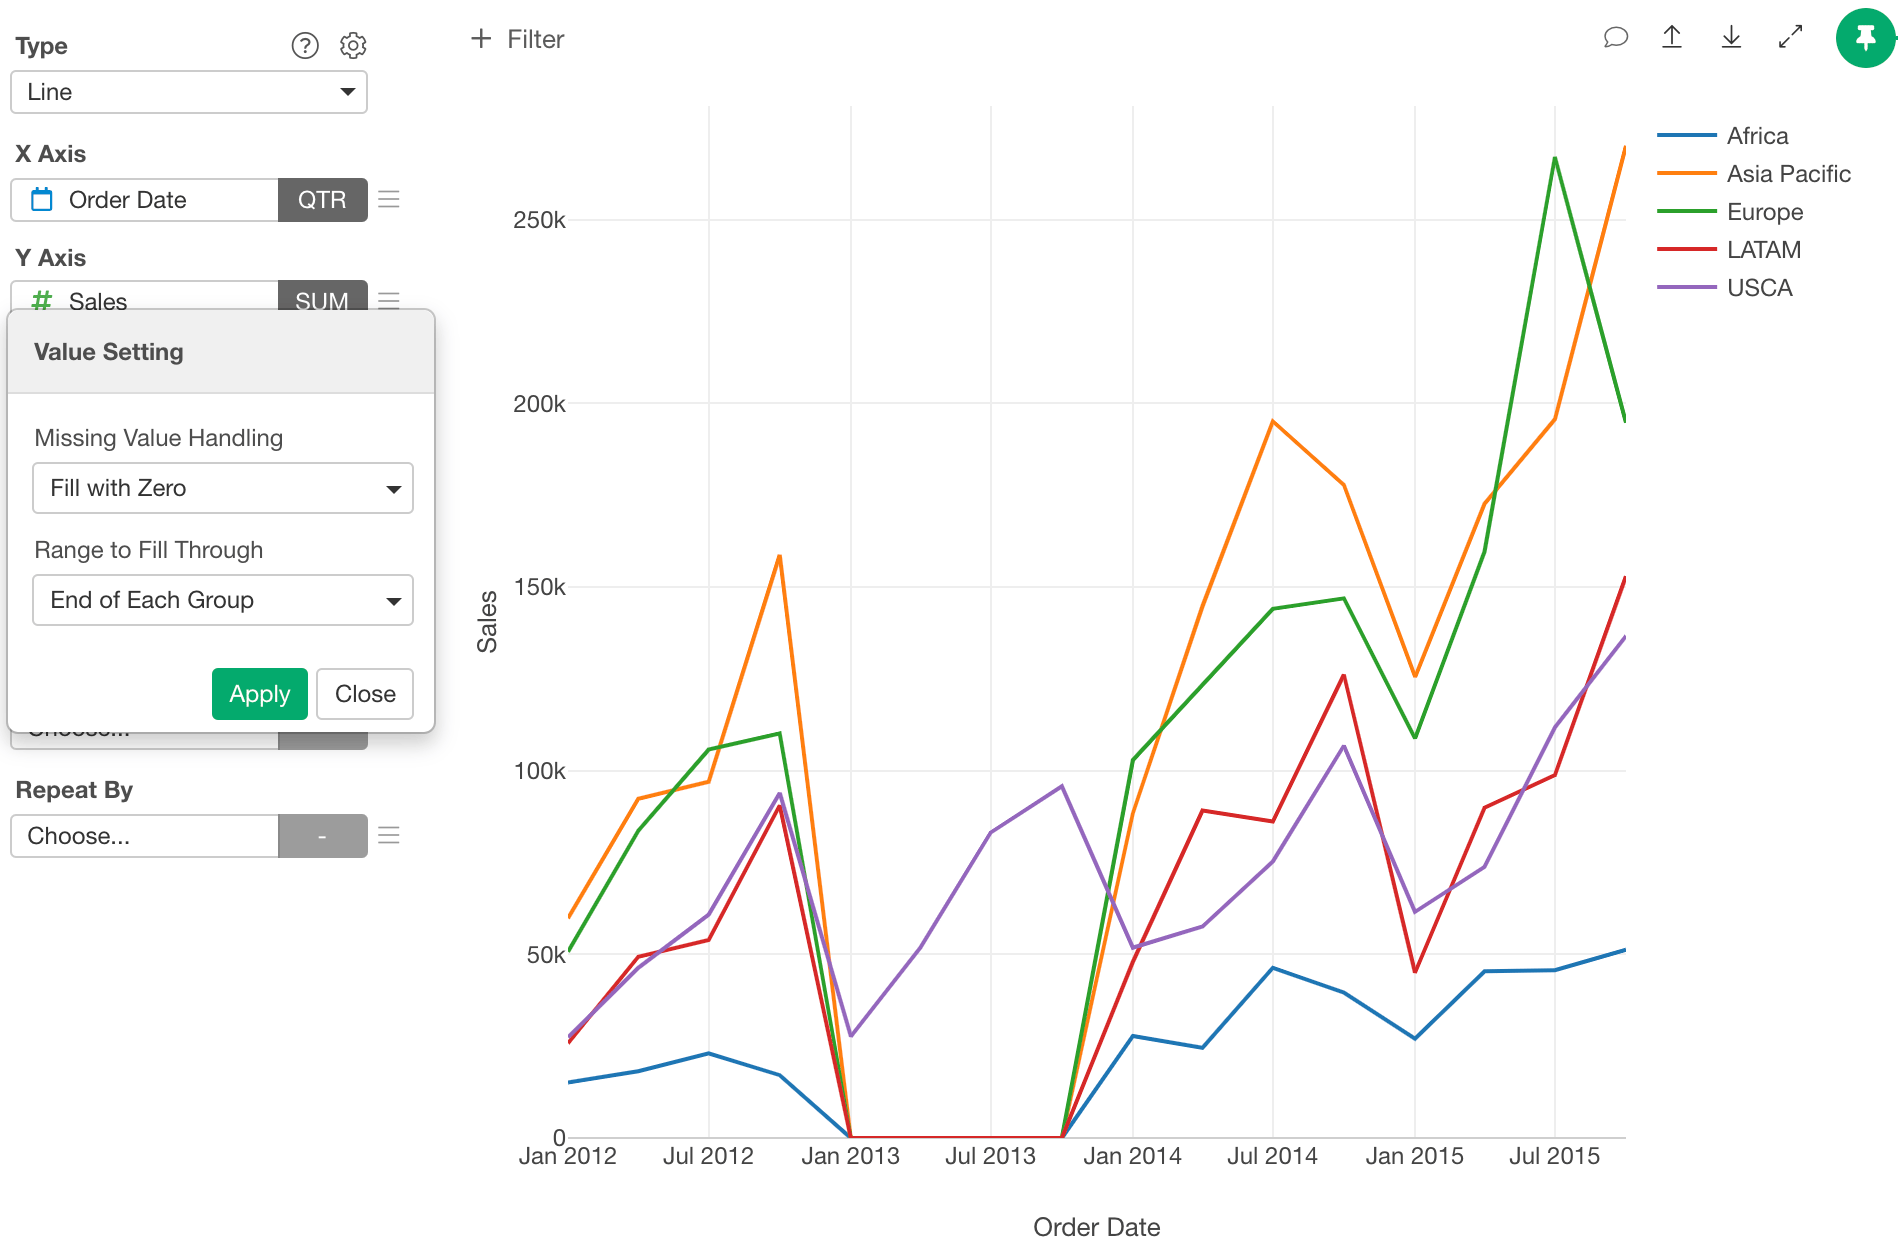
Fill with Previous Value
It fills missing values with the previous values.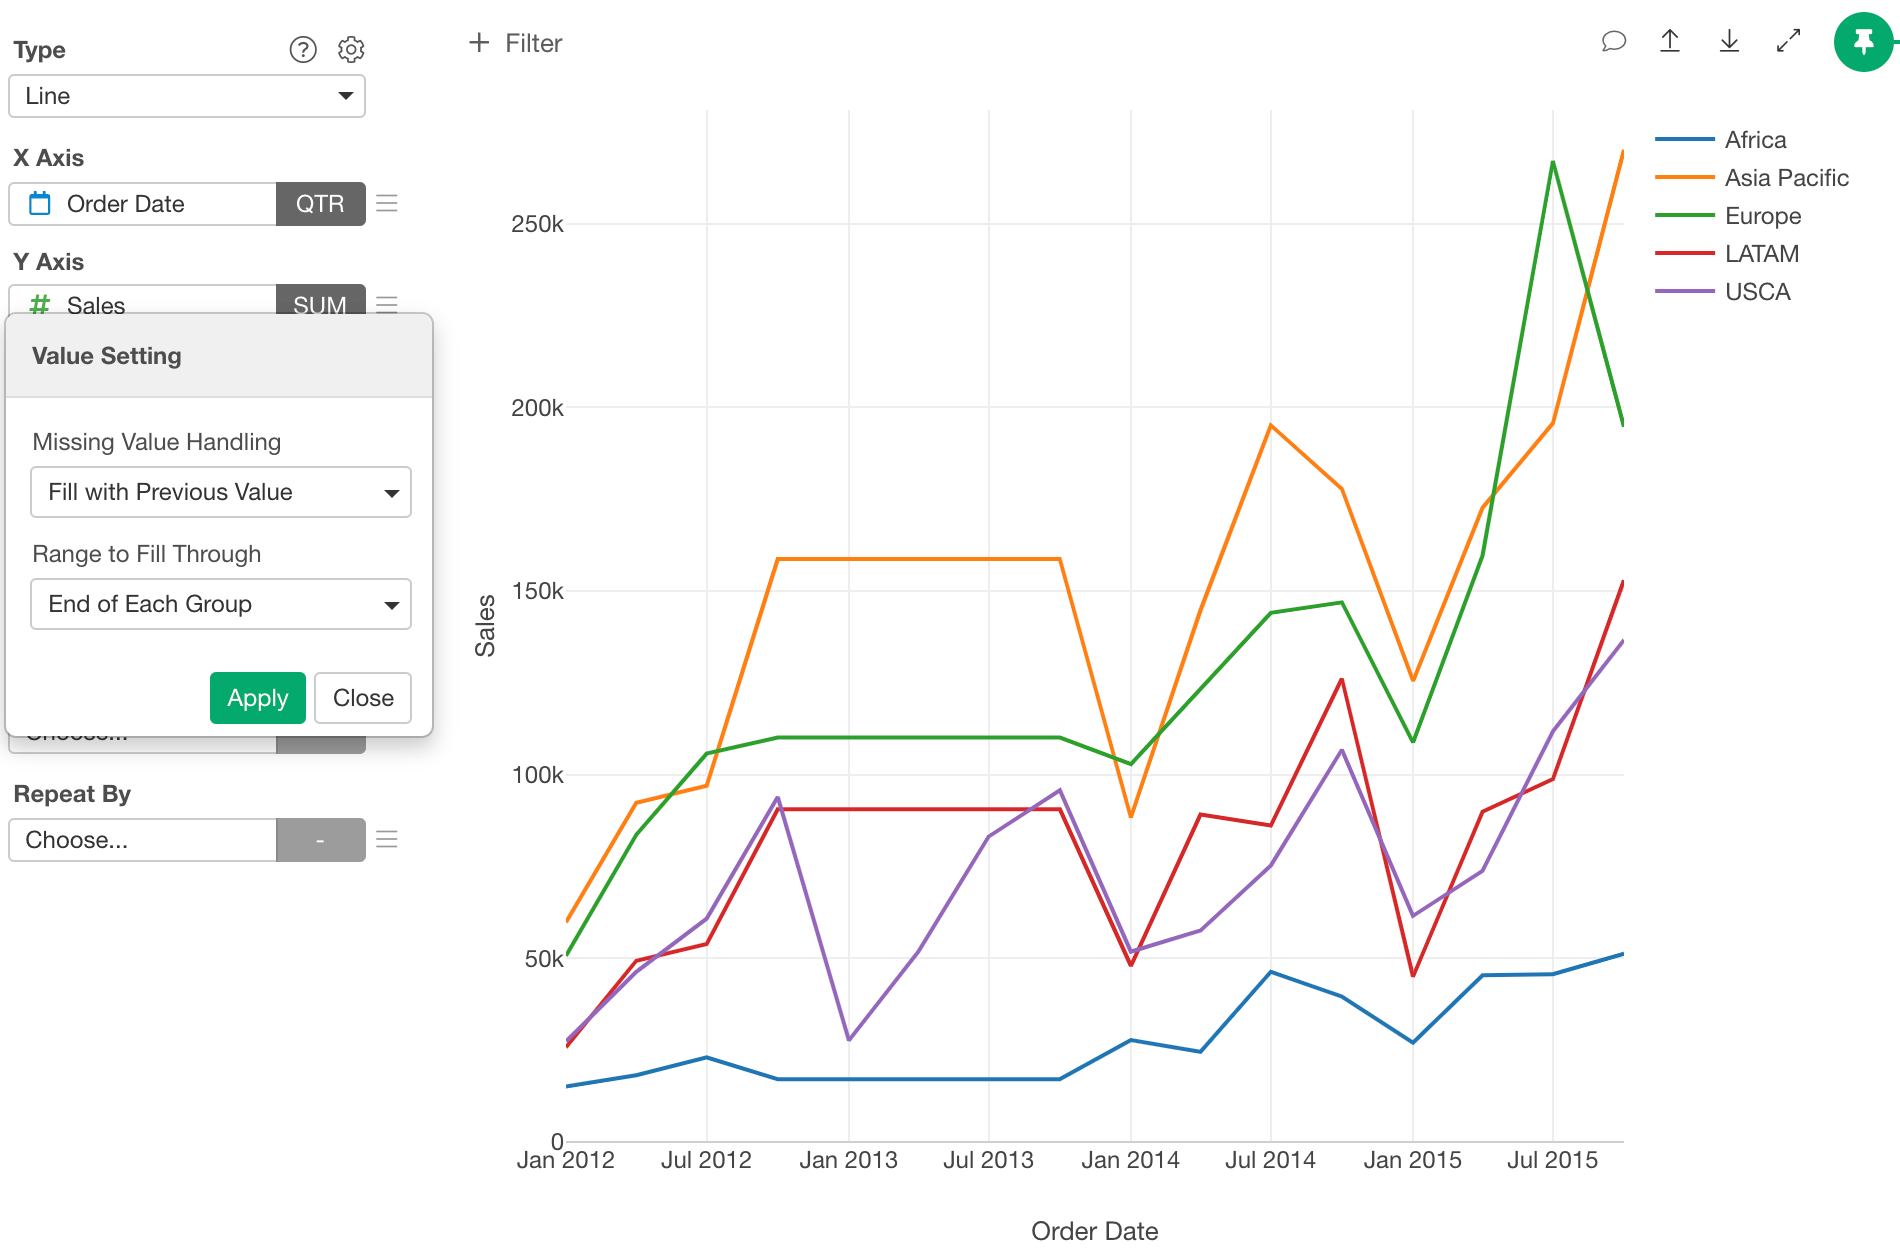
Fill with Next Value
It fills missing values with the next values.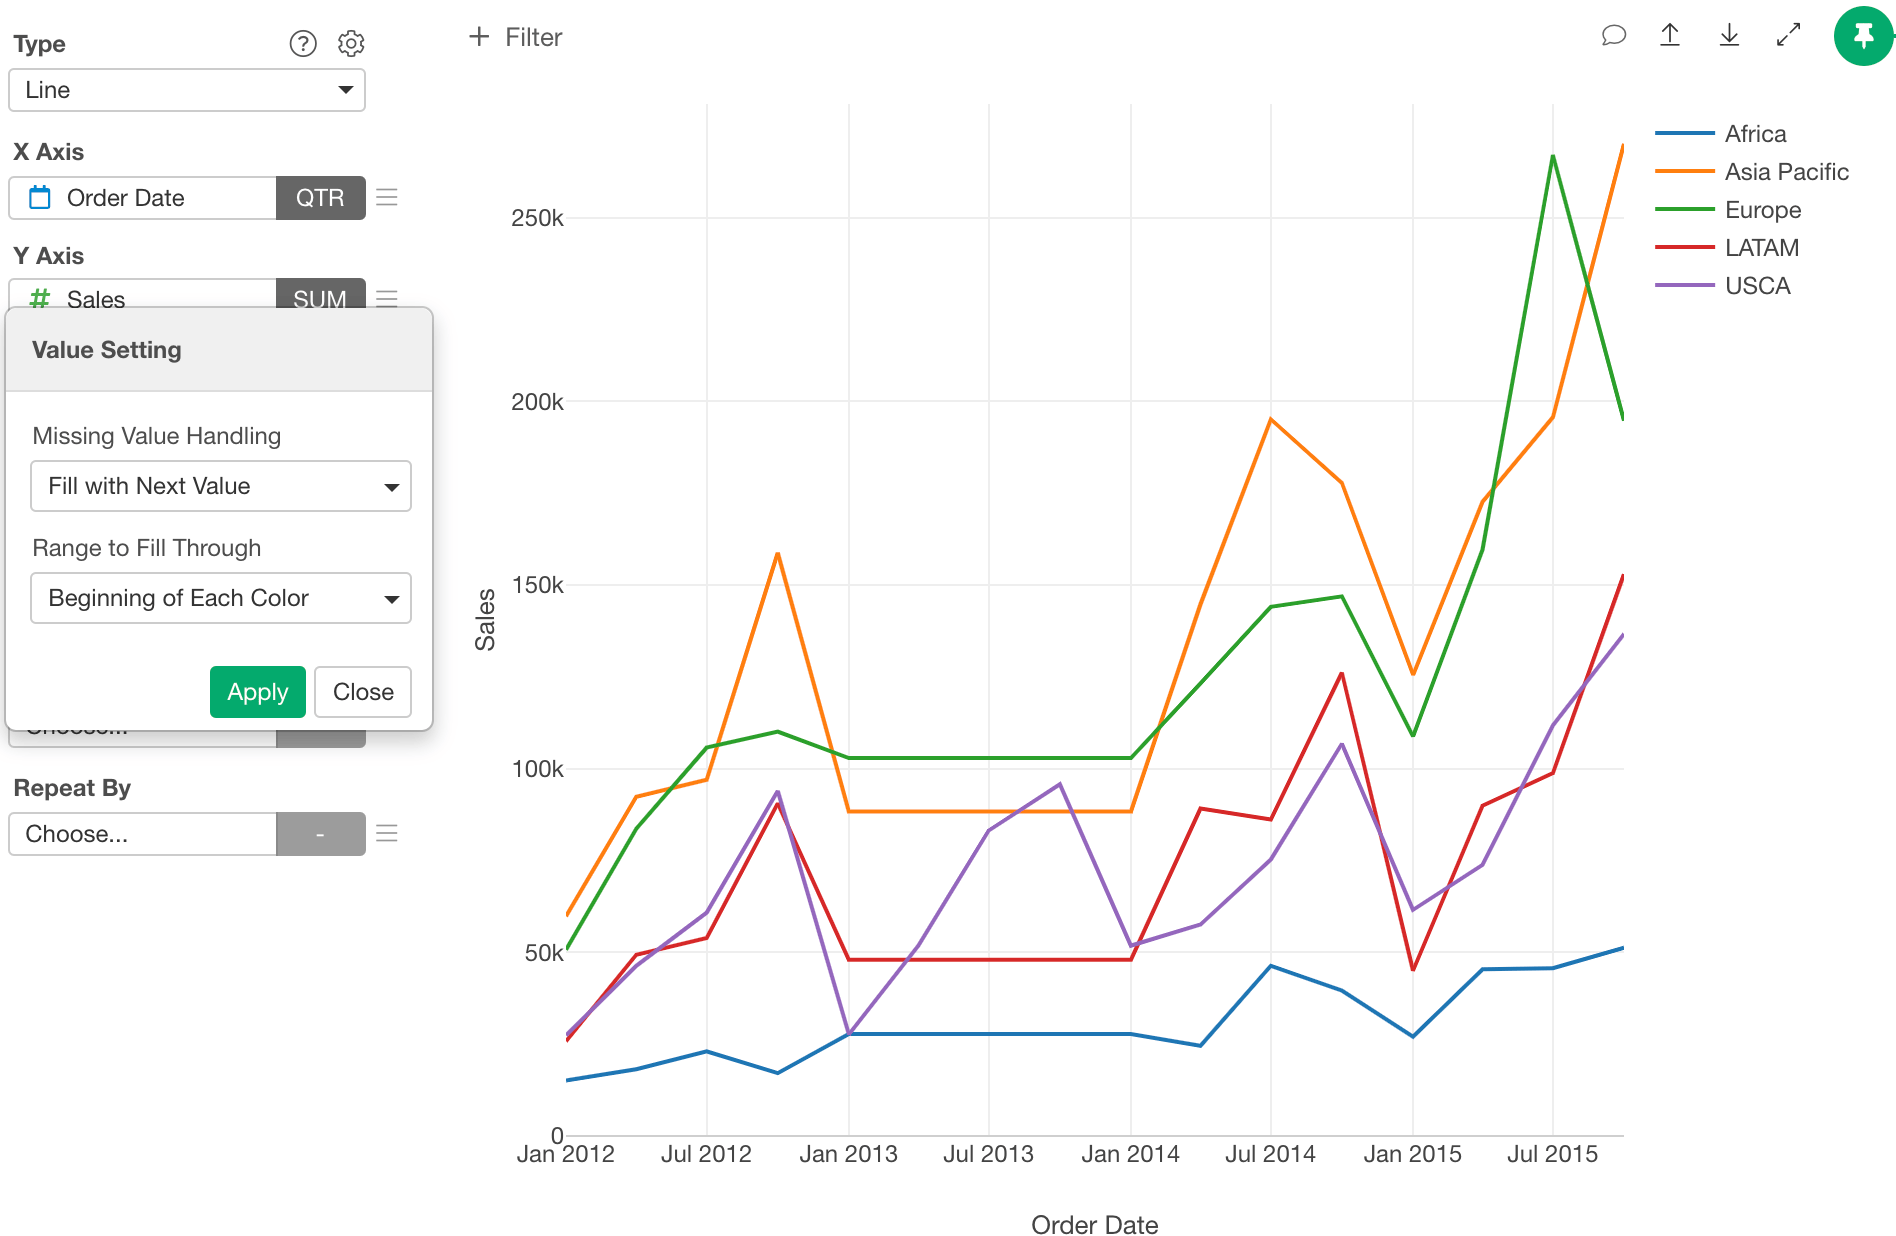
Direction
You can select the direction how you fill the missing values. The following options are available. This option is available only in Pivot Table and Summarize Table.- All (Down then Across)
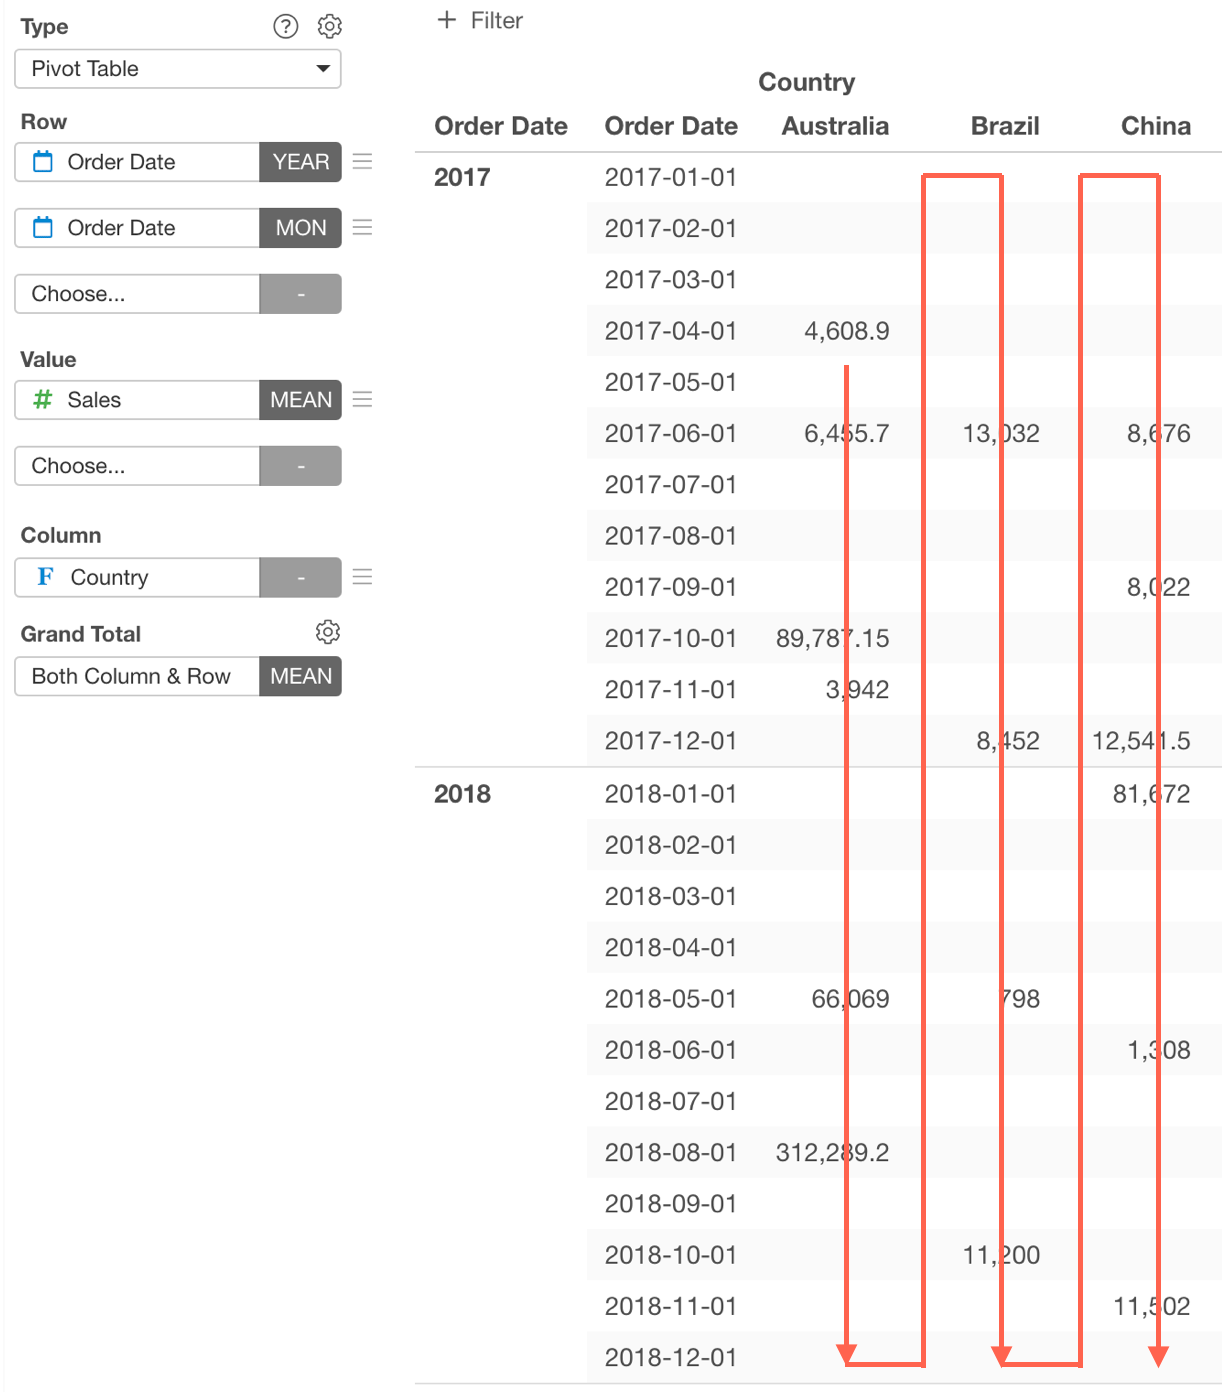
- Row (Across)
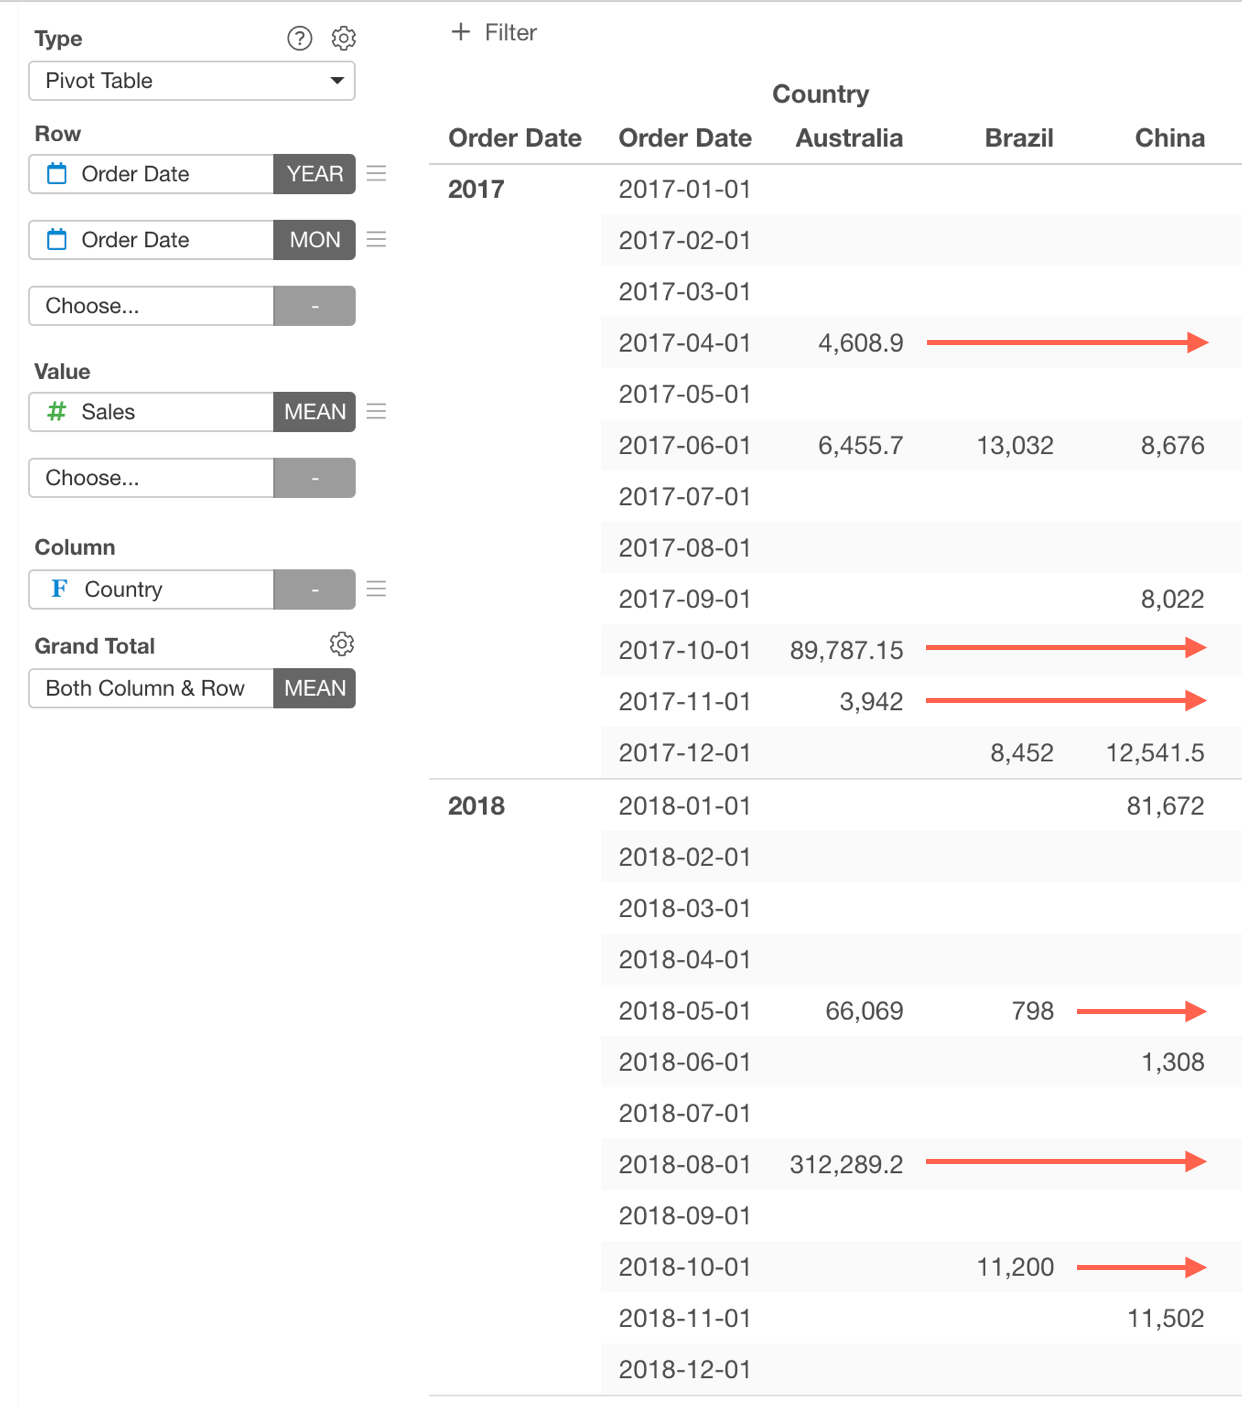
- Column (Down)
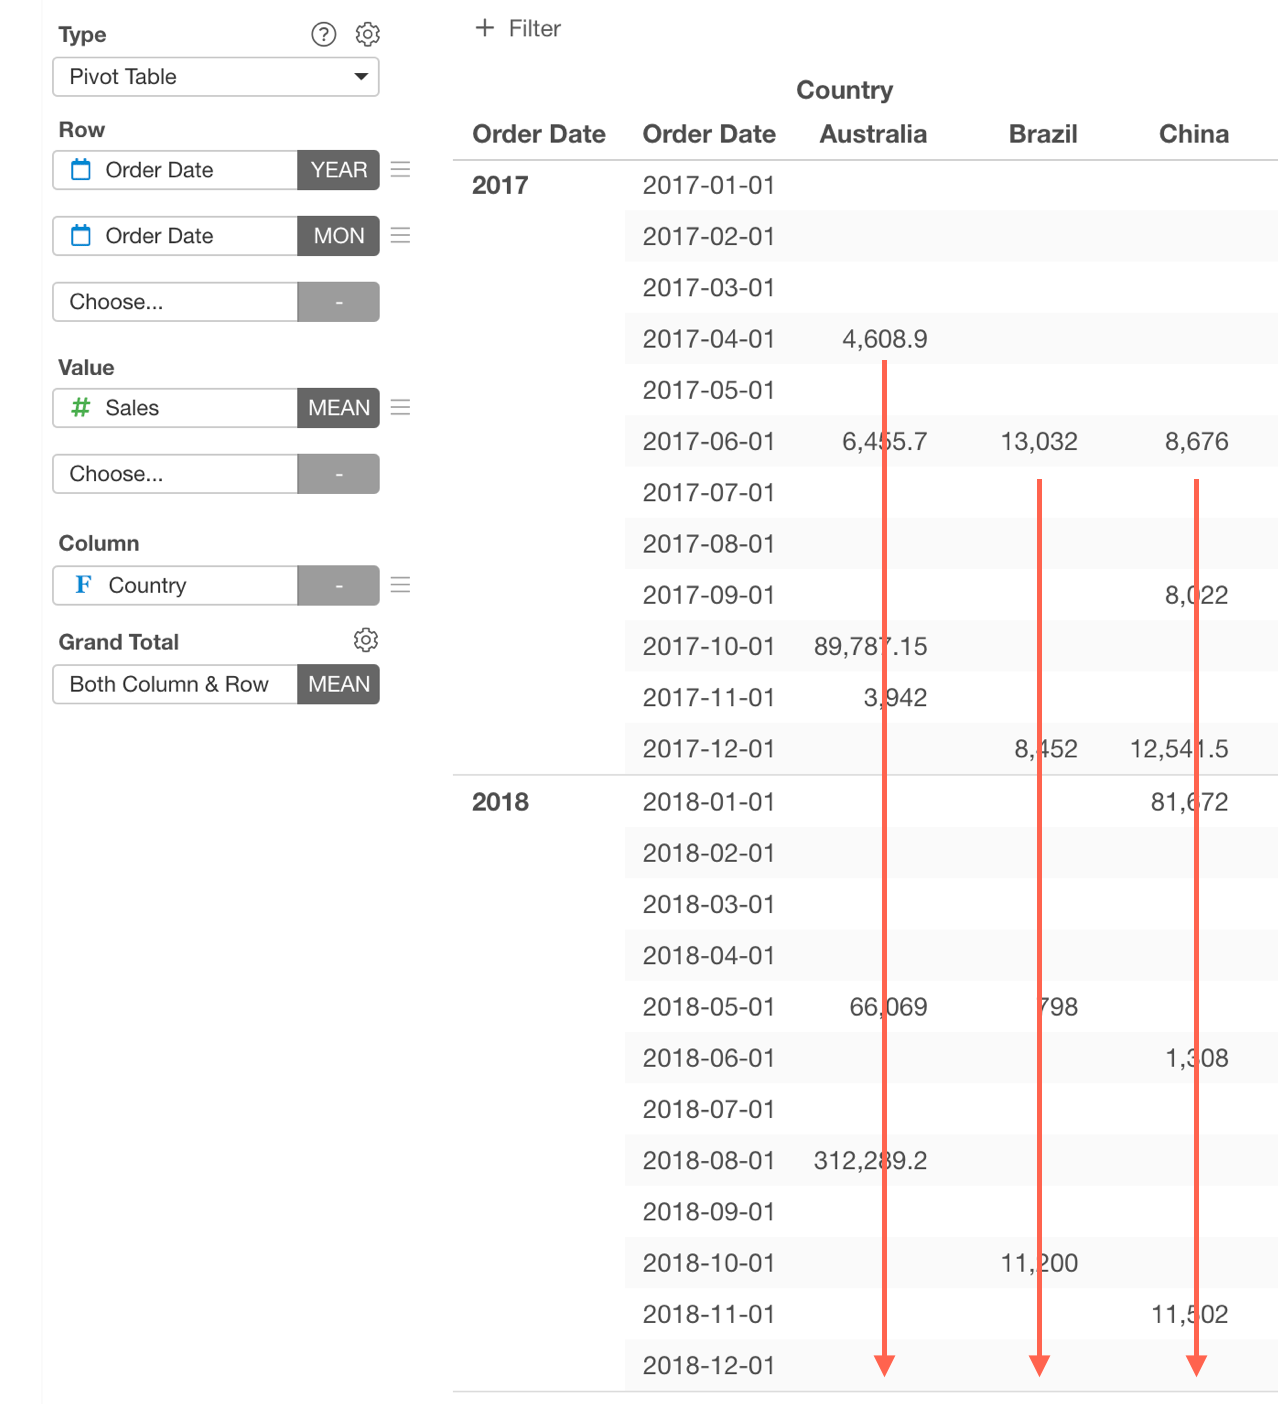
- Column (Down within Group)
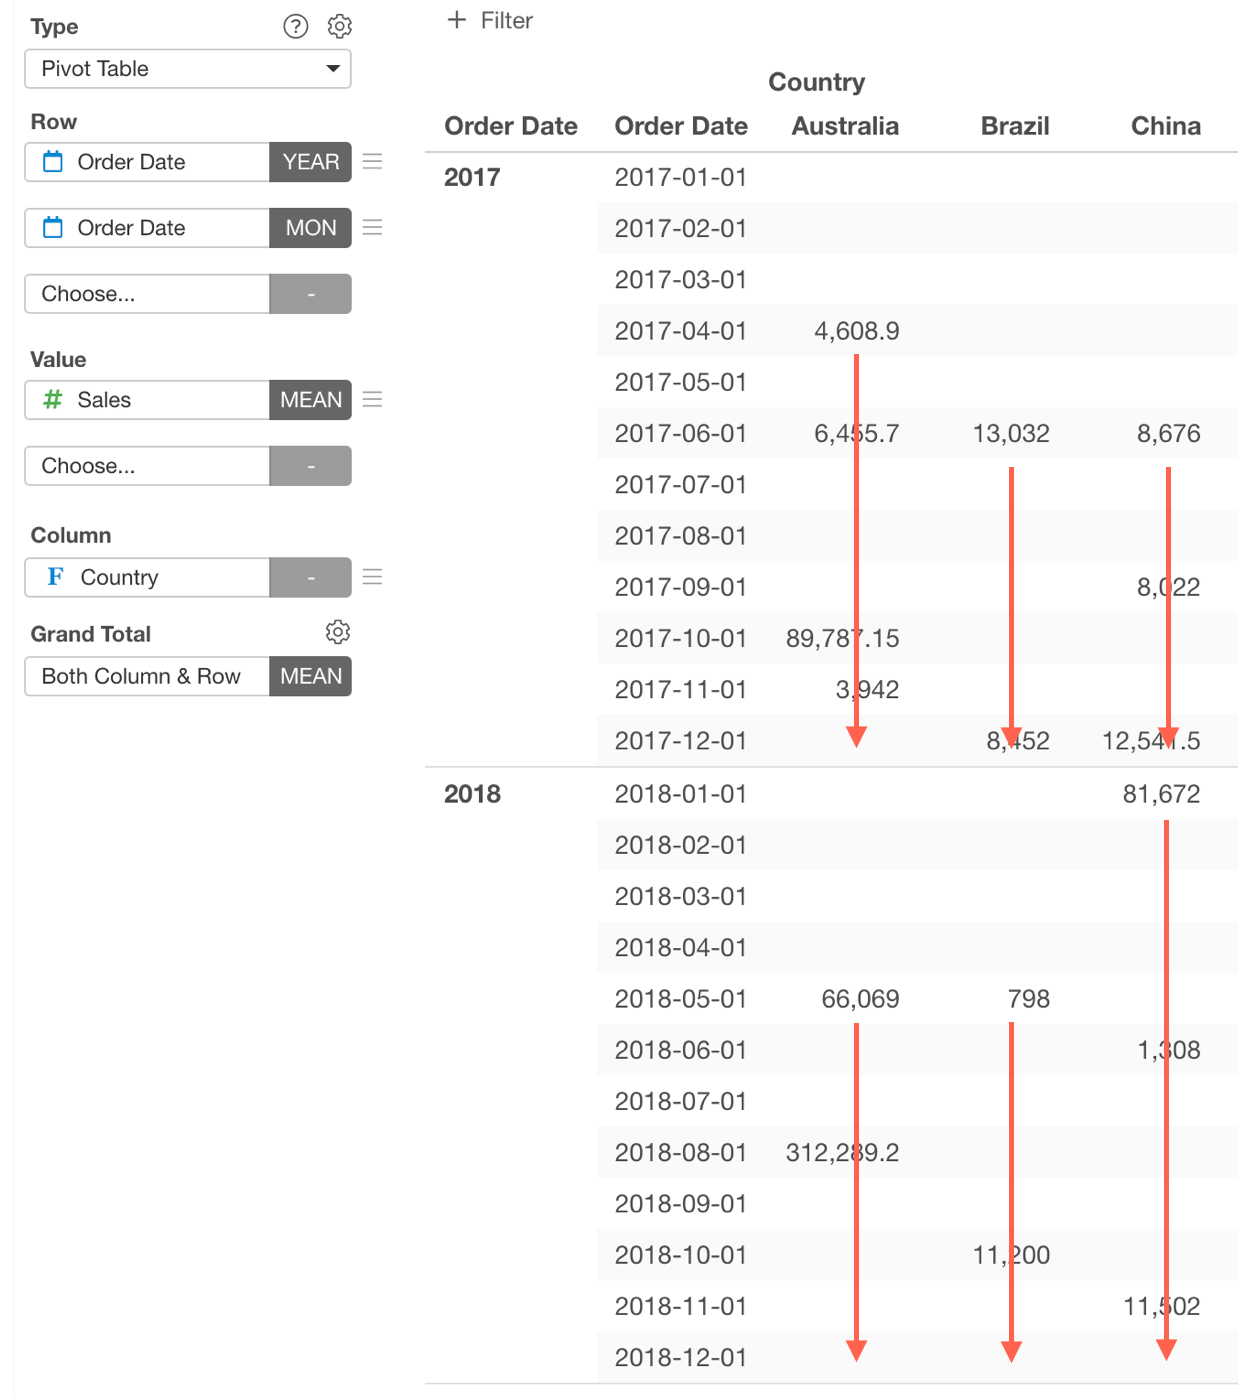
- Column (Down then Across within Group)
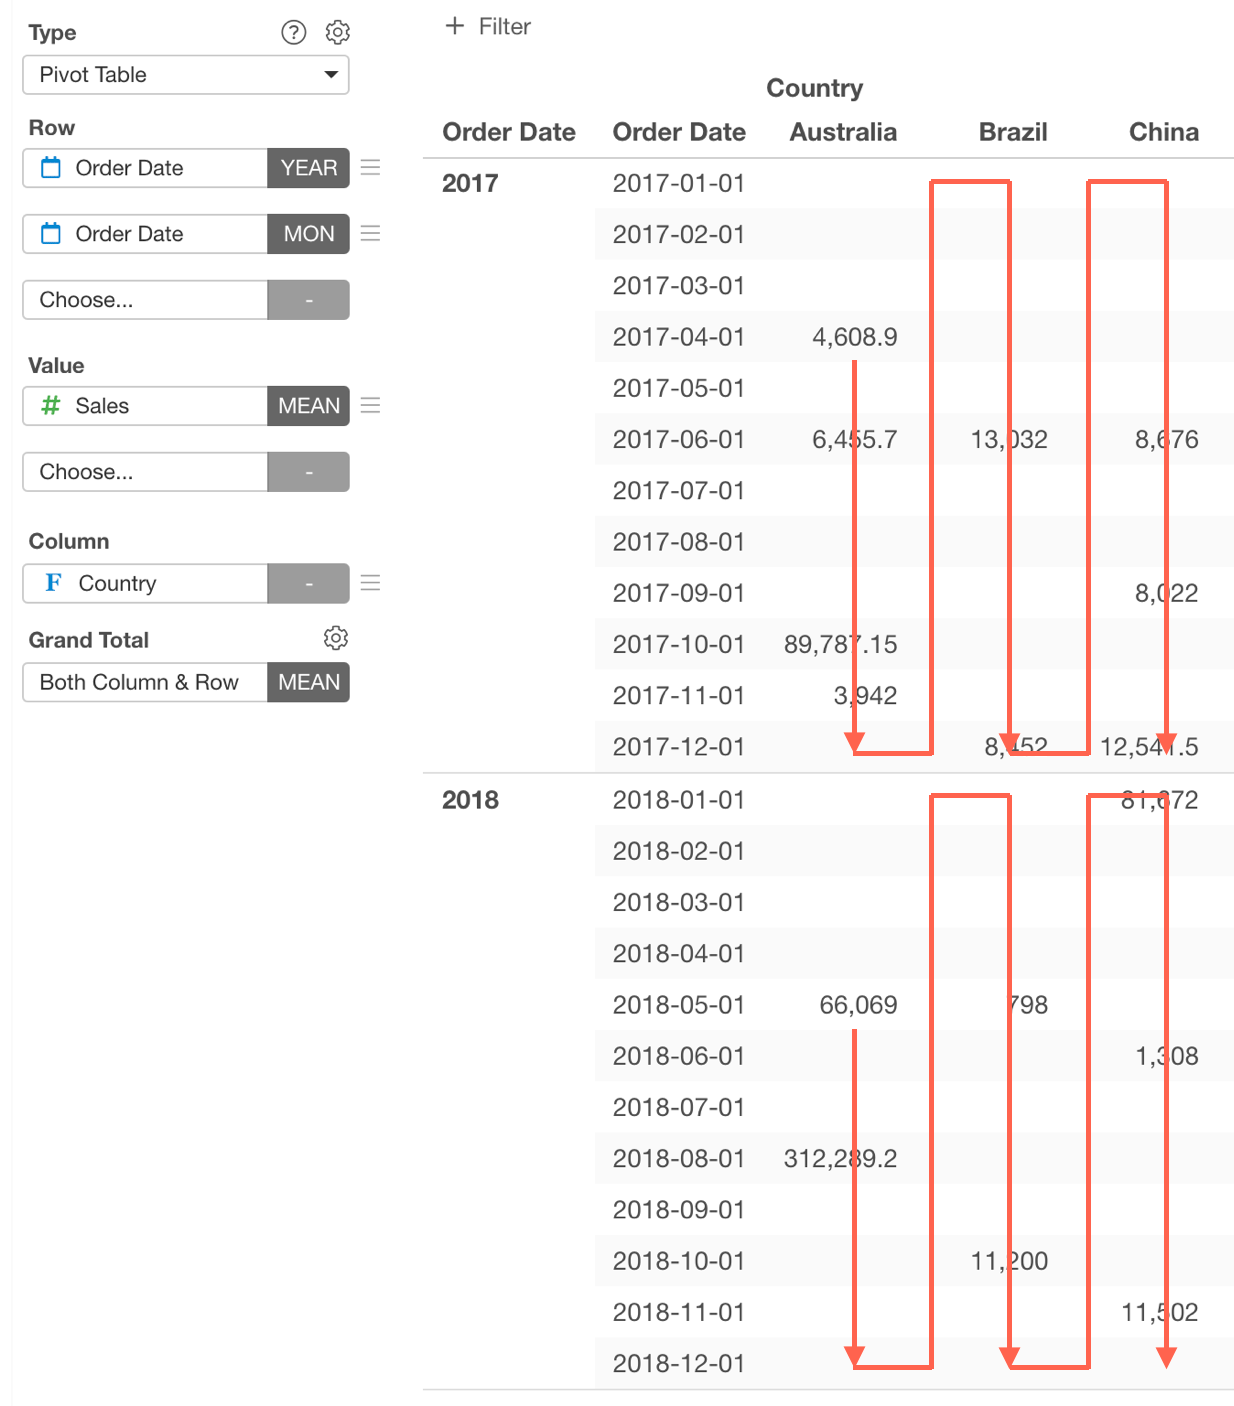
Range to Fill Through
For the “Fill with Previous Value” and “Fill with Next Value” options, you have the “Range to Fill Through” option. The following options are available.- End of Each Group - Value filling happens within each group (Color and Repeat By) range.
- End of All - Value filling happens for the whole data range.