Types
The following Calculation Types are available.Cumulative (Running Total)
The “Cumulative” calculation calculates the current value based on the previous values in each group.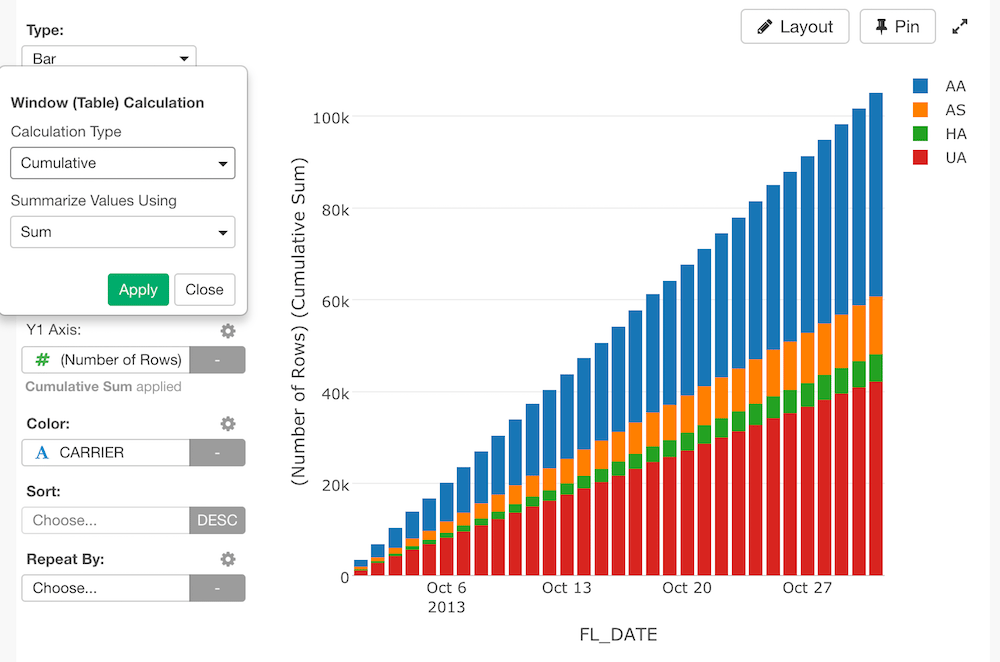
Sum.
- Sum
- Sum Ratio - Sum of the ratio against the total. The last value in the group will be 100%.
- Mean (Average)
- Min Value
- Max Value
- Product
Percent (%) of Total
The “Percent of Total” calculates the ratio of values in each group. There are the following options available. The default isSum (Total).
- Sum (Total)
- Mean (Average)
- Median
- Mode (Most Frequent)
- Min Value
- Max Value
- First Value
- Last Value
- Previous Value (LAG) - Shows the previous values in the group.
- Next Value (LEAD) - Shows the next values in the group.
X Axis.
- X Axis - Calculate the ratio for each X-Axis data point. The total percentages on each X value will be 100%.
- Color - Calculate the ratio for each color value. The total percentage of each color value will be 100%. For example, in the following chart, the total percentage of blue bars is 100%, and the same for other colors.
- All - Calculate the ratio based on all data points. The total percentage of all the data points will be 100%.
Difference From
The “Difference From” calculates the difference from the specified position. There are the following options where you compare the differences from. The default isMean.
- Mean (Average)
- Median
- Mode (Most Frequent)
- Min Value
- Max Value
- First Value
- Last Value
- Previous Value (LAG) - Shows the previous values in the group.
- Next Value (LEAD) - Shows the next values in the group.
- Period Ago (TS_LAG) - Shows the value of a certain period ago. For example, the value last month. This option is available only if the Date or POSIXct column is assigned to the grouping column such as X-Axis, Row of the Pivot Table, etc.
- Specific Value - Difference from a specific value that you give.
Percent (%) Difference From
The “Percent (%) Difference From” calculates the difference ratio from the specified position. There are the following options where you compare the differences from. The default isMean.
- Mean (Average)
- Median
- Mode (Most Frequent)
- Min Value
- Max Value
- First Value
- Last Value
- Previous Value (LAG) - Shows the previous values in the group.
- Next Value (LEAD) - Shows the next values in the group.
- Period Ago (TS_LAG) - Shows the value of a certain period ago. For example, the value last month. This option is available only if the Date or POSIXct column is assigned to the grouping column such as X-Axis, Row of the Pivot Table, etc.
- Specific Value - Difference from a specific value that you give.
Value Of
The “Value Of” gets the values at the specific position. The following Default isPrevious Value.
- Previous Value (LAG) - Shows the previous values in the group.
- Next Value (LEAD) - Shows the next values in the group.
- Period Ago (TS_LAG) - Shows the value of a certain period ago. For example, the value last month. This option is available only if the Date or POSIXct column is assigned to the grouping column such as X-Axis, Row of the Pivot Table, etc.
Moving Calculation
The “Moving Calculation” calculates values by summarizing the data points in the window (range) around each data point.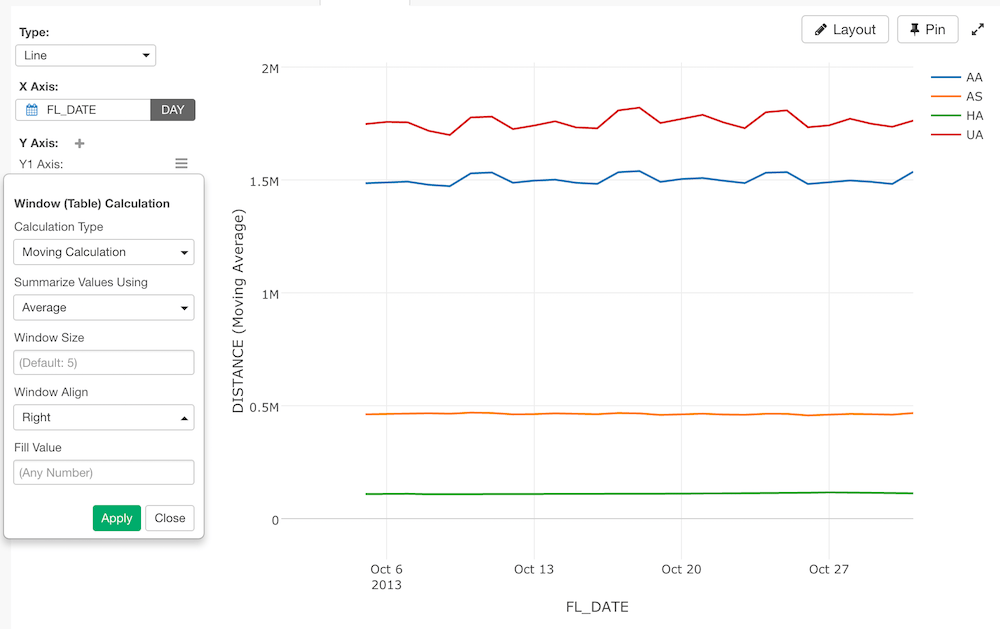
- Summarize Values Using - Type of calculations to apply to data points in the window. The default is
Average. - Sum
- Mean (Average)
- Min Value
- Max Value
- Median
- Standard Deviation
- Variance
- Sum
- Product
- Window Size - Number of data points to include in each window. The default is 5.
- Window Align - How to define the boundary of each window. For example, if you set
Right, each window includes the target data point plus 4 left data points. - Right
- Center
- Left
- Fill Value - Value to fill the empty data points. The default is empty.
Rank
The “Rank” calculates the rank of the values in the group.- Order
- Ascending
- Descending
- Rank Type
- Min Rank
- Dense Rank
- Percent Rank
Options
- Remove NA - Whether you want to remove NA values before applying a Window Calculation or not.
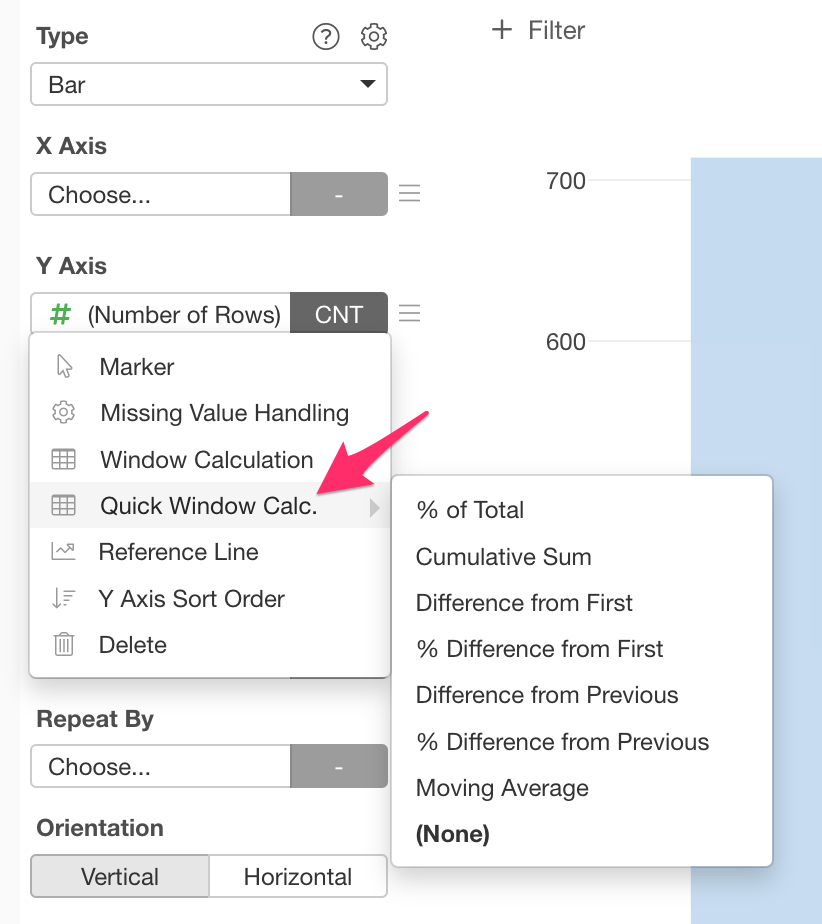
Quick Window Calculation
You can reach the popular Window Calculations quickly from the Quick Window Calculation menu. It is just a shortcut to the Window Calculation and you can customize it like a regular Window Calculation.