
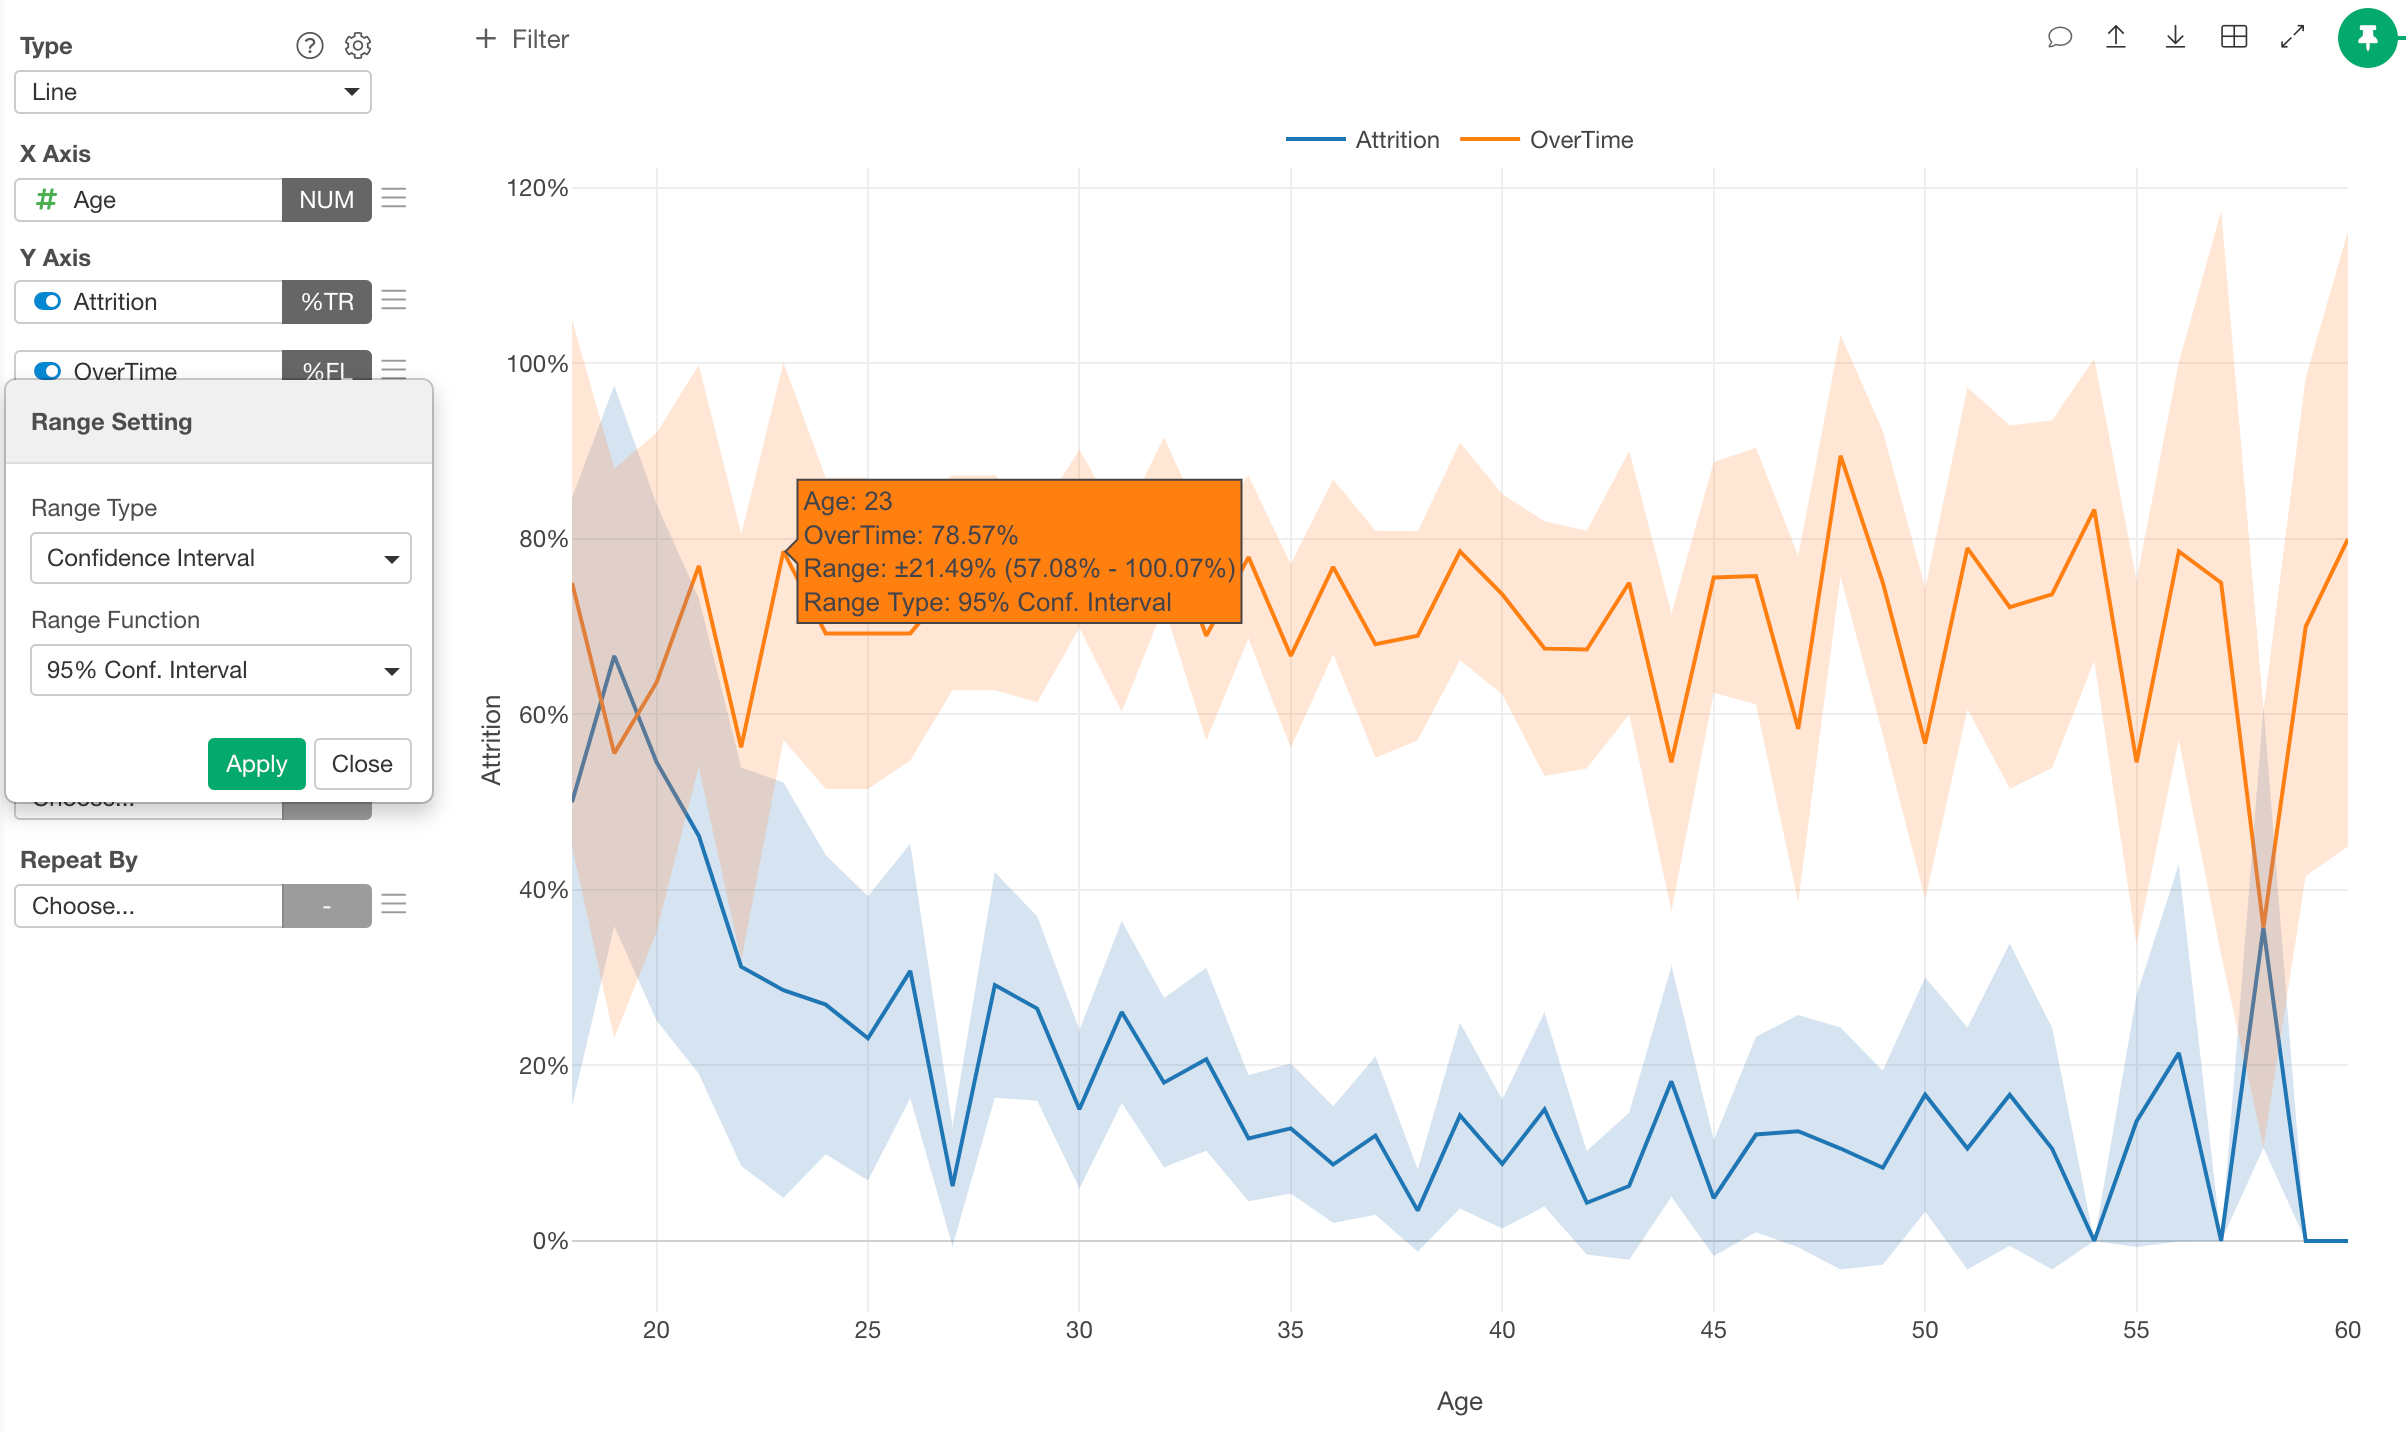
Setup the Range
You can set up the range from the Range Dialog. You can find the Range Dialog in the Y-Axis menu dropdown.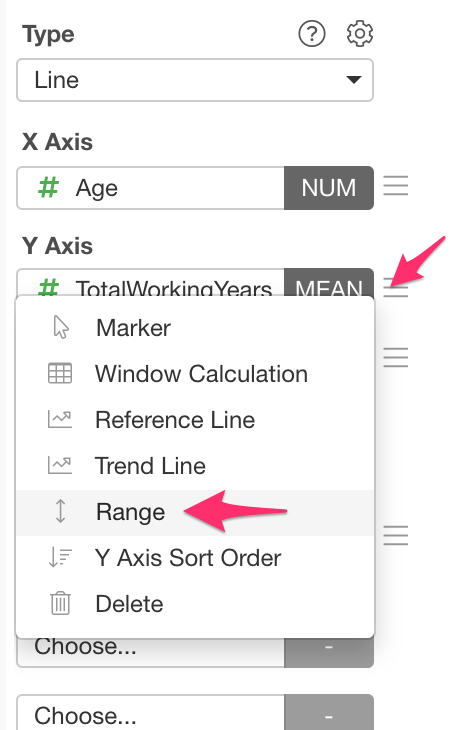
Range Types
There are 2 range types available.- Confidence Interval
- Column
- Specific Value
Confidence Interval
The Confidence Interval option calculates confidence interval ranges from data and shows them automatically on a chart. You can show confidence interval ranges by selecting the “Confidence Interval” from the Range Type menu in the Range Setting Dialog.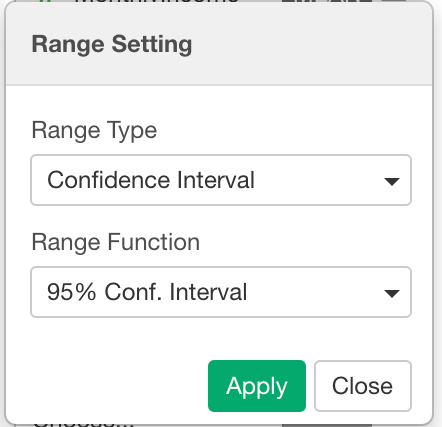
- 90% Condfidence Interval
- 95% Condfidence Interval
- 99% Condfidence Interval
- Standard Error
Column
If you already have columns for upper and lower limit values for the values on Y-Axis, you can show them as ranges in the same chart. You can select “Custom” from the Range Type menu and assign columns for Upper Limit values and Lower Limit values.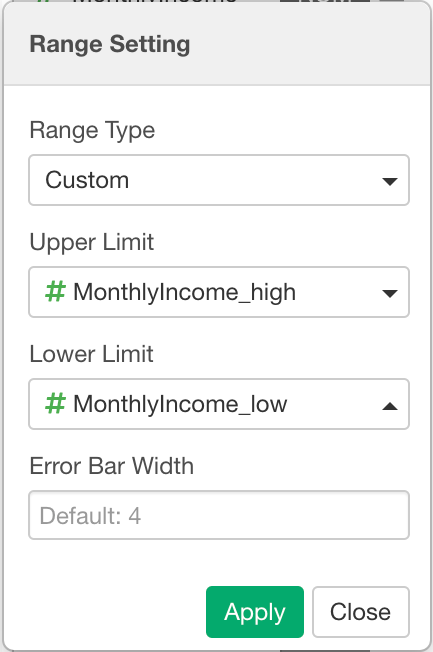
(Y-Axis Column Name)_highand(Y-Axis Column Name)_low(Y-Axis Column Name).highand(Y-Axis Column Name).low(Y-Axis Column Name)_upperand(Y-Axis Column Name)_lower(Y-Axis Column Name).upperand(Y-Axis Column Name).lower(Y-Axis Column Name)_higherand(Y-Axis Column Name)_lower(Y-Axis Column Name).higherand(Y-Axis Column Name).lowerconf_highandconf_lowconf.highandconf.low
Specific Value
You can specify the range by setting the upper and lower value manually.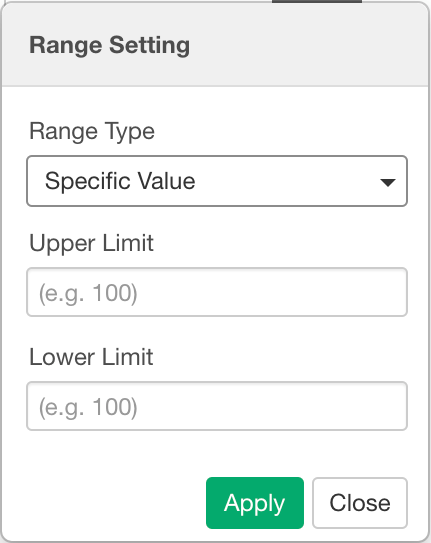
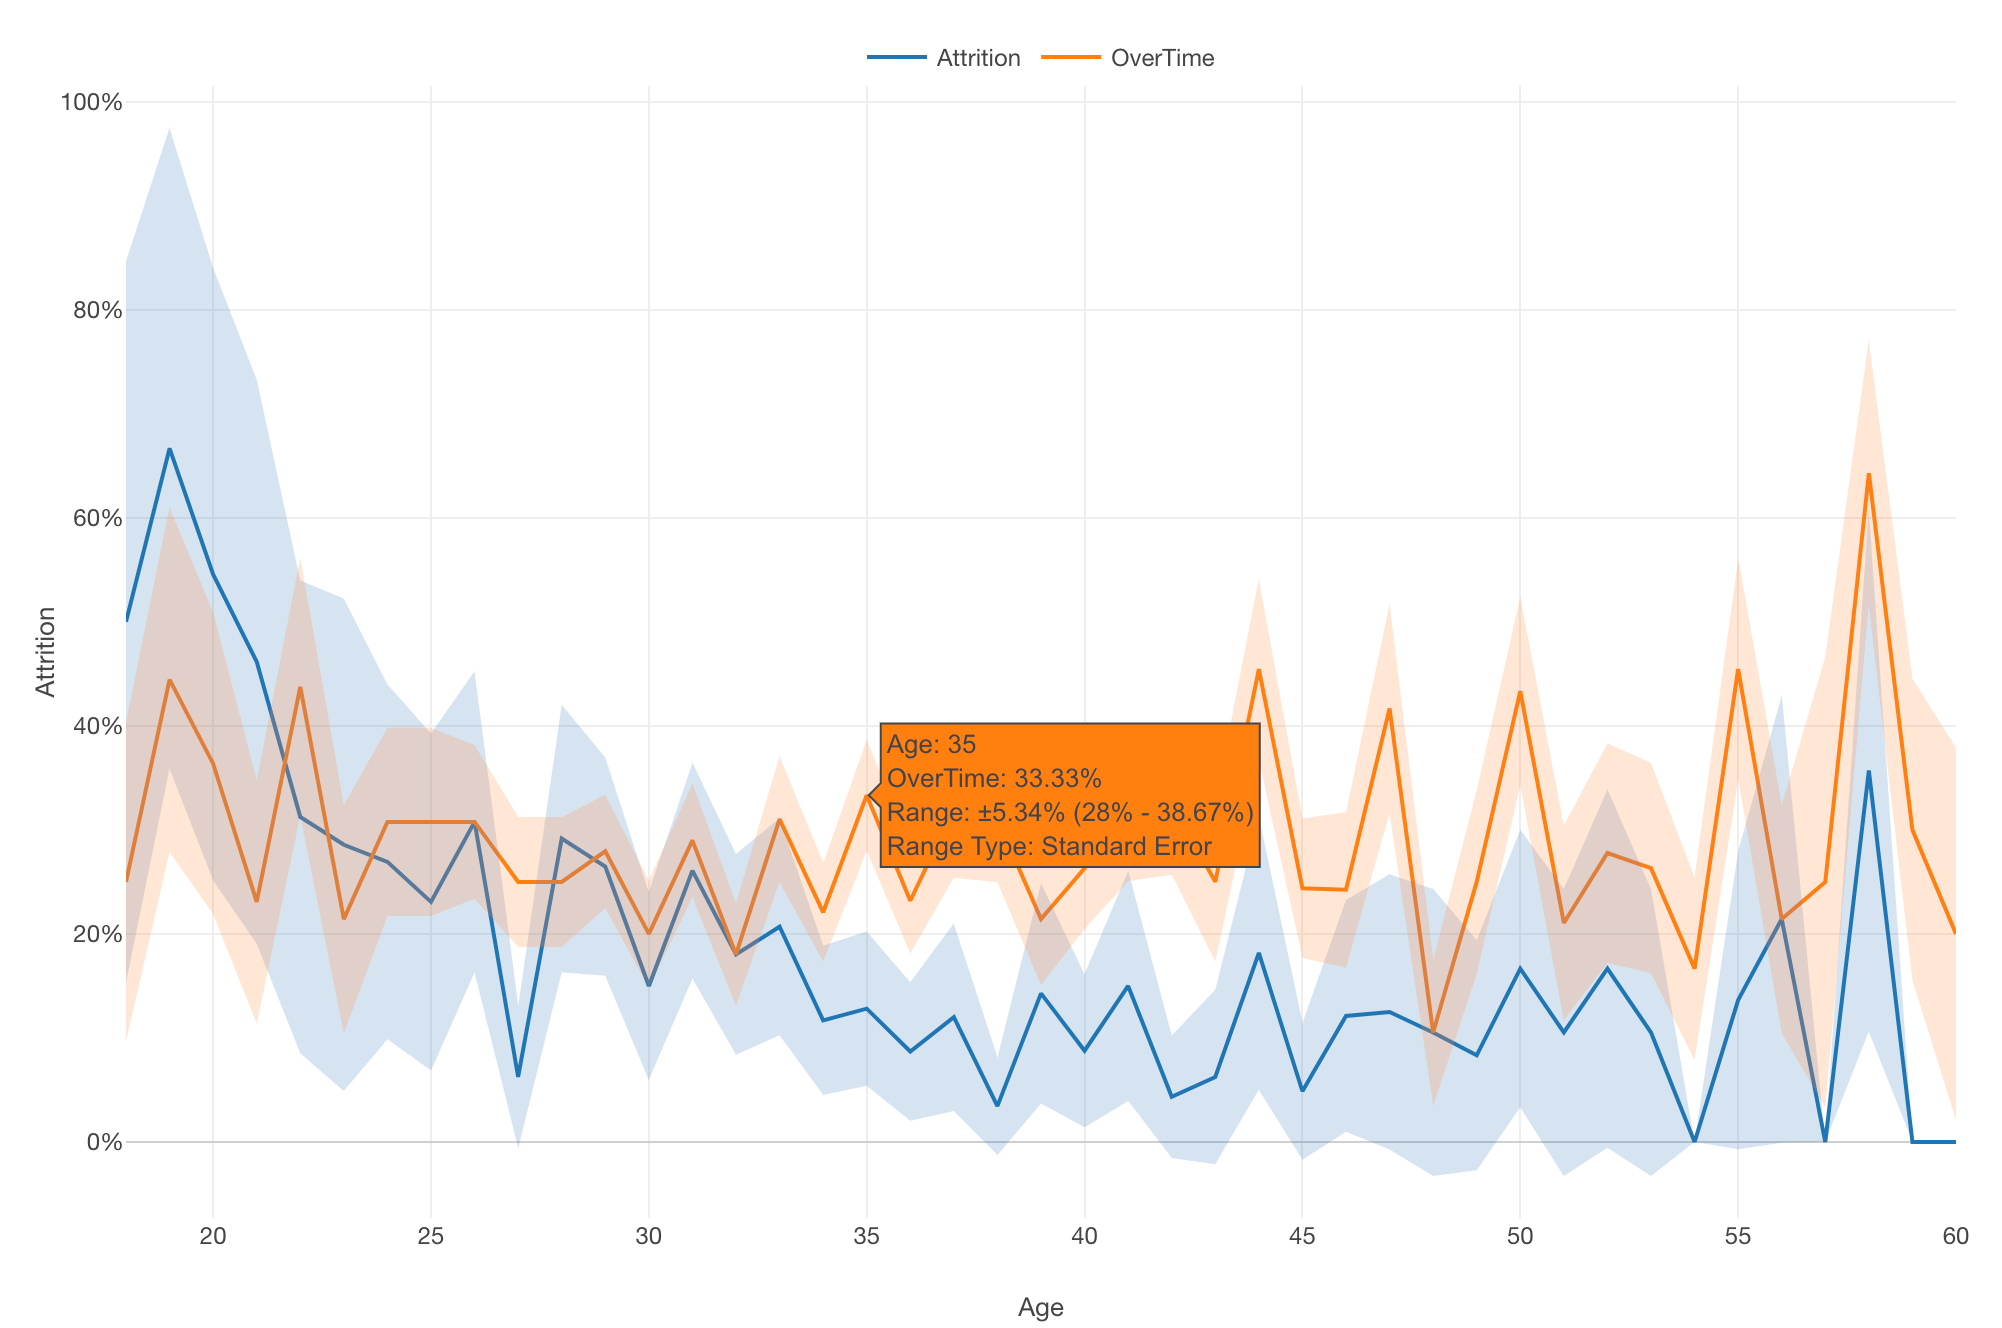
Range in Line Chart
The following range types are available in Line chart.- Confidence Interval
- Custom
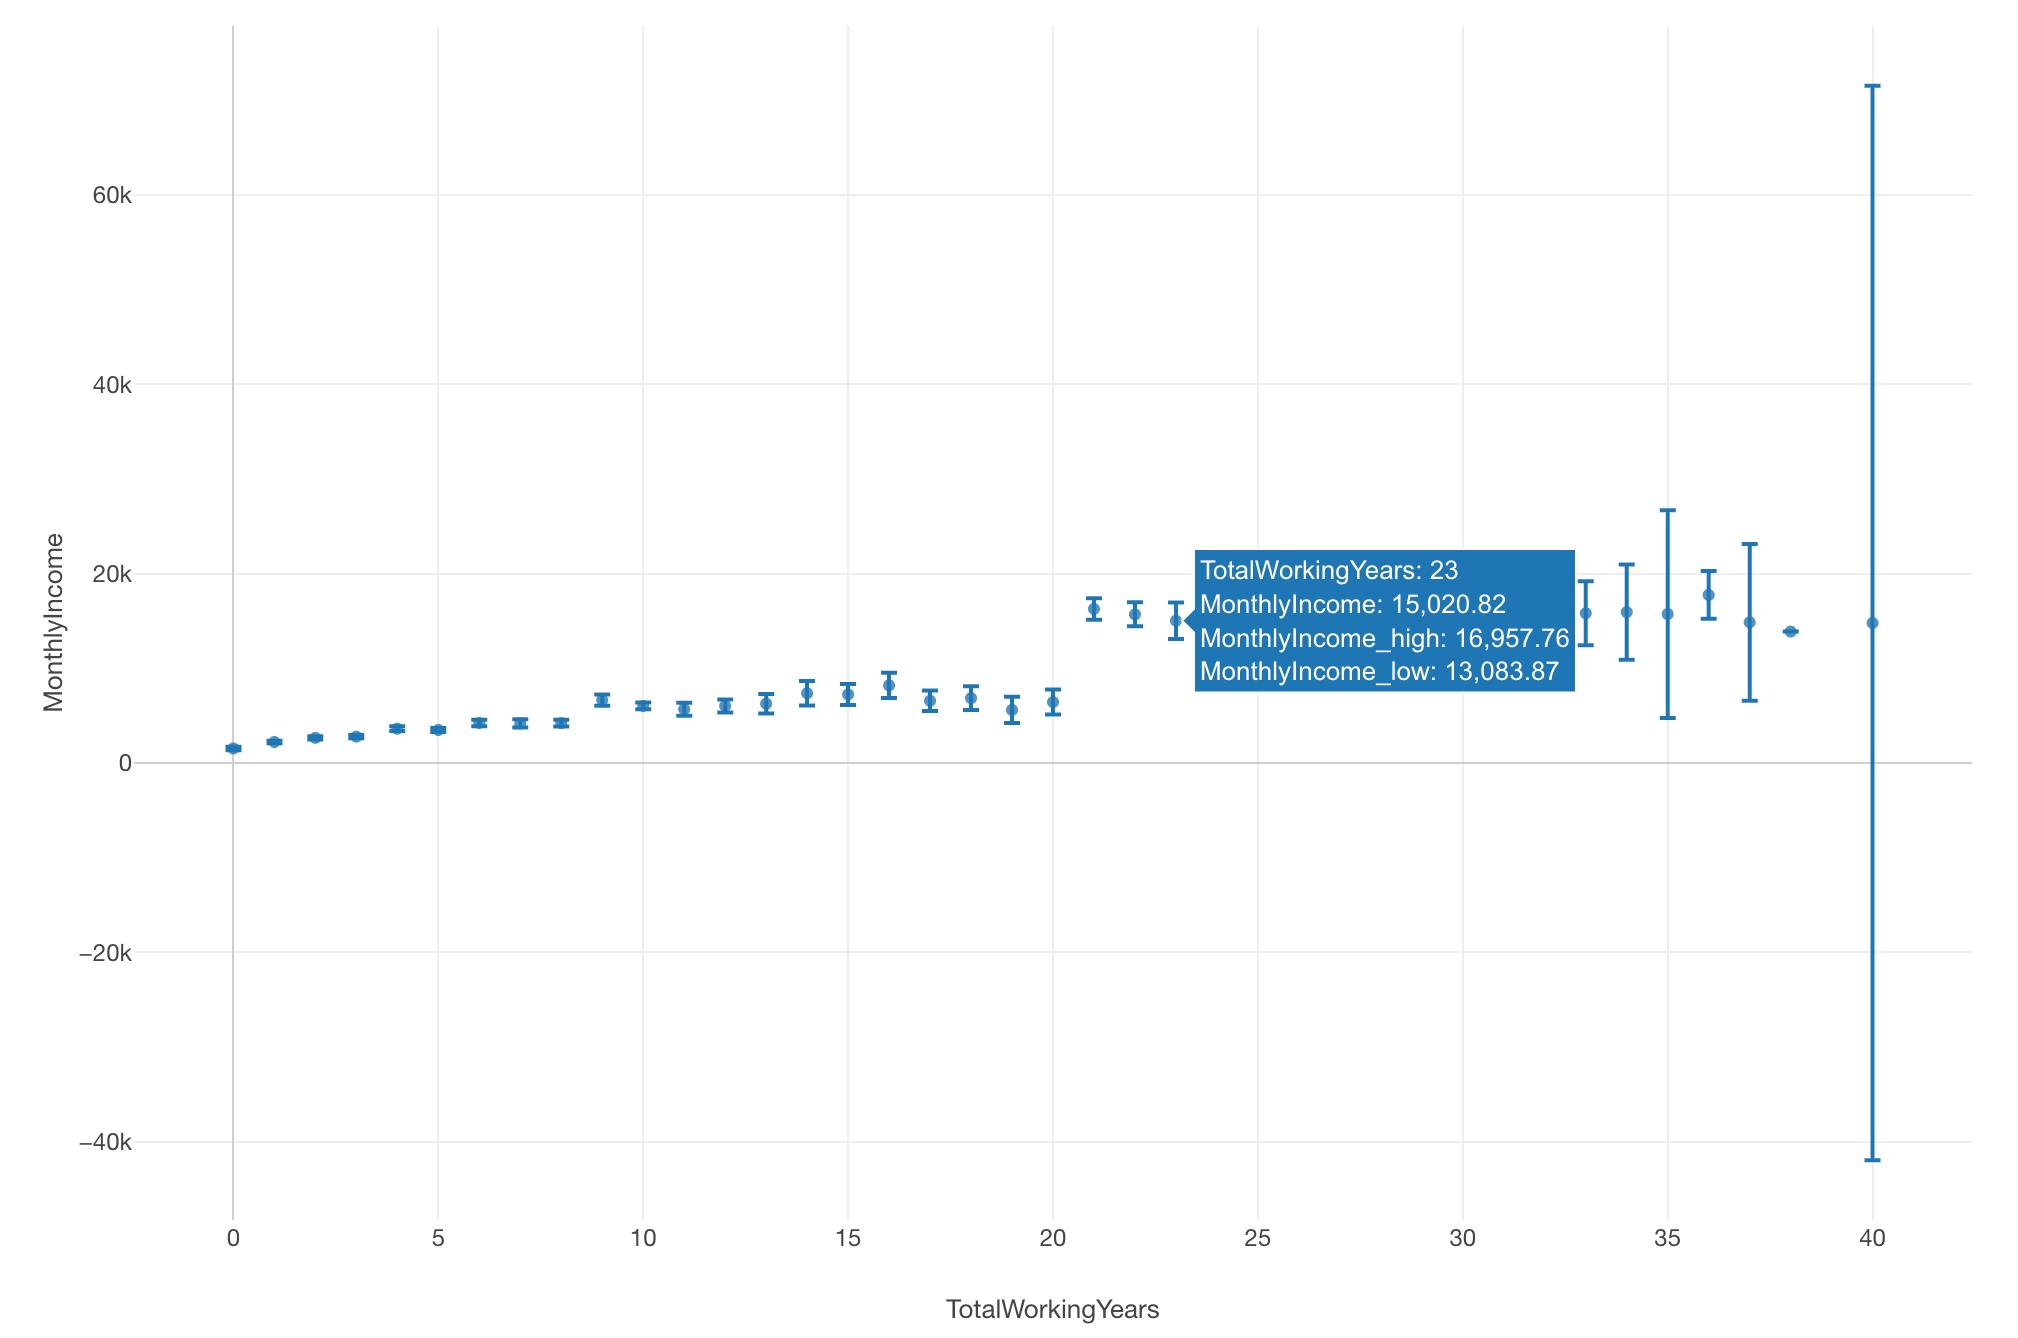
Range in Scatter (No Aggregation) Chart
The following range types are available in Scatter (No Aggregation) Chart- Custom
4 in pixel.