
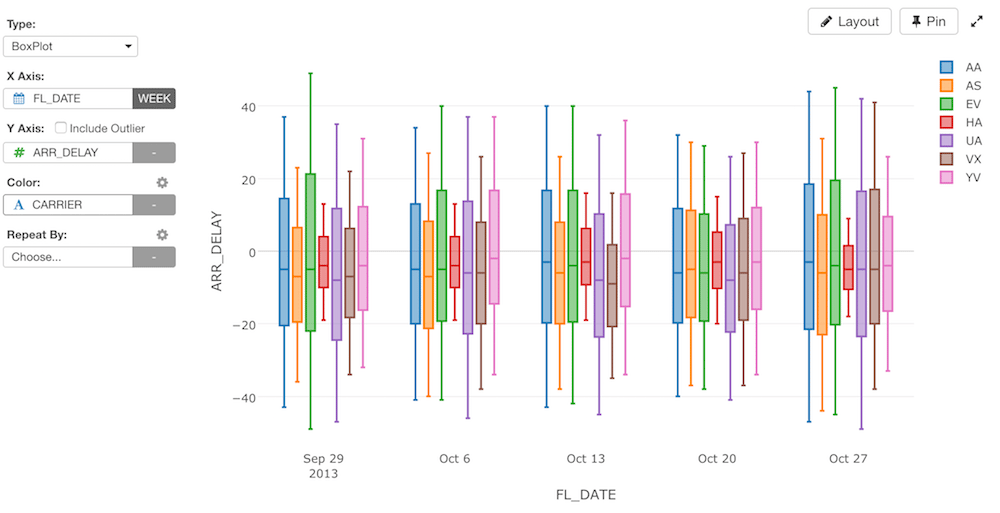
Column Assignments
- X-Axis - Assign a column you want to show at X-Axis. If it’s a Date / Time column assigned, you can select the aggregation level such as
Month,Week,Day, etc. If you assign a Number column, you can choose eitherAs Numberto treat values as continuous values orAs Textto treat values as categorical values. - Y-Axis - Assign a column you want to show at Y-Axis. You can include/exclude the outlier by the
Include Outliercheckbox. - Color - Take a look at Color section for more details.
- Sort By - Assign a column to use for Sorting the X-Axis values. The default is based on either the alphabetic order or the factor level order for Factor type columns. You can also select which aggreagation function for sorting from the Sort Setting dialog. The following aggregation functions are available.
- Sum
- Mean (Average)
- Median
- Min Value
- Max Value
- First
- Last
- Standard Deviation
- IQR (Interquartile Range)
- Repeat By - You can assign a column to repeat the chart for each of its values. Take a look at Repeat By section for more details.
- Orientation - You can choose a chart orientation. Either ‘Vertical’ or ‘Horizontal’.