
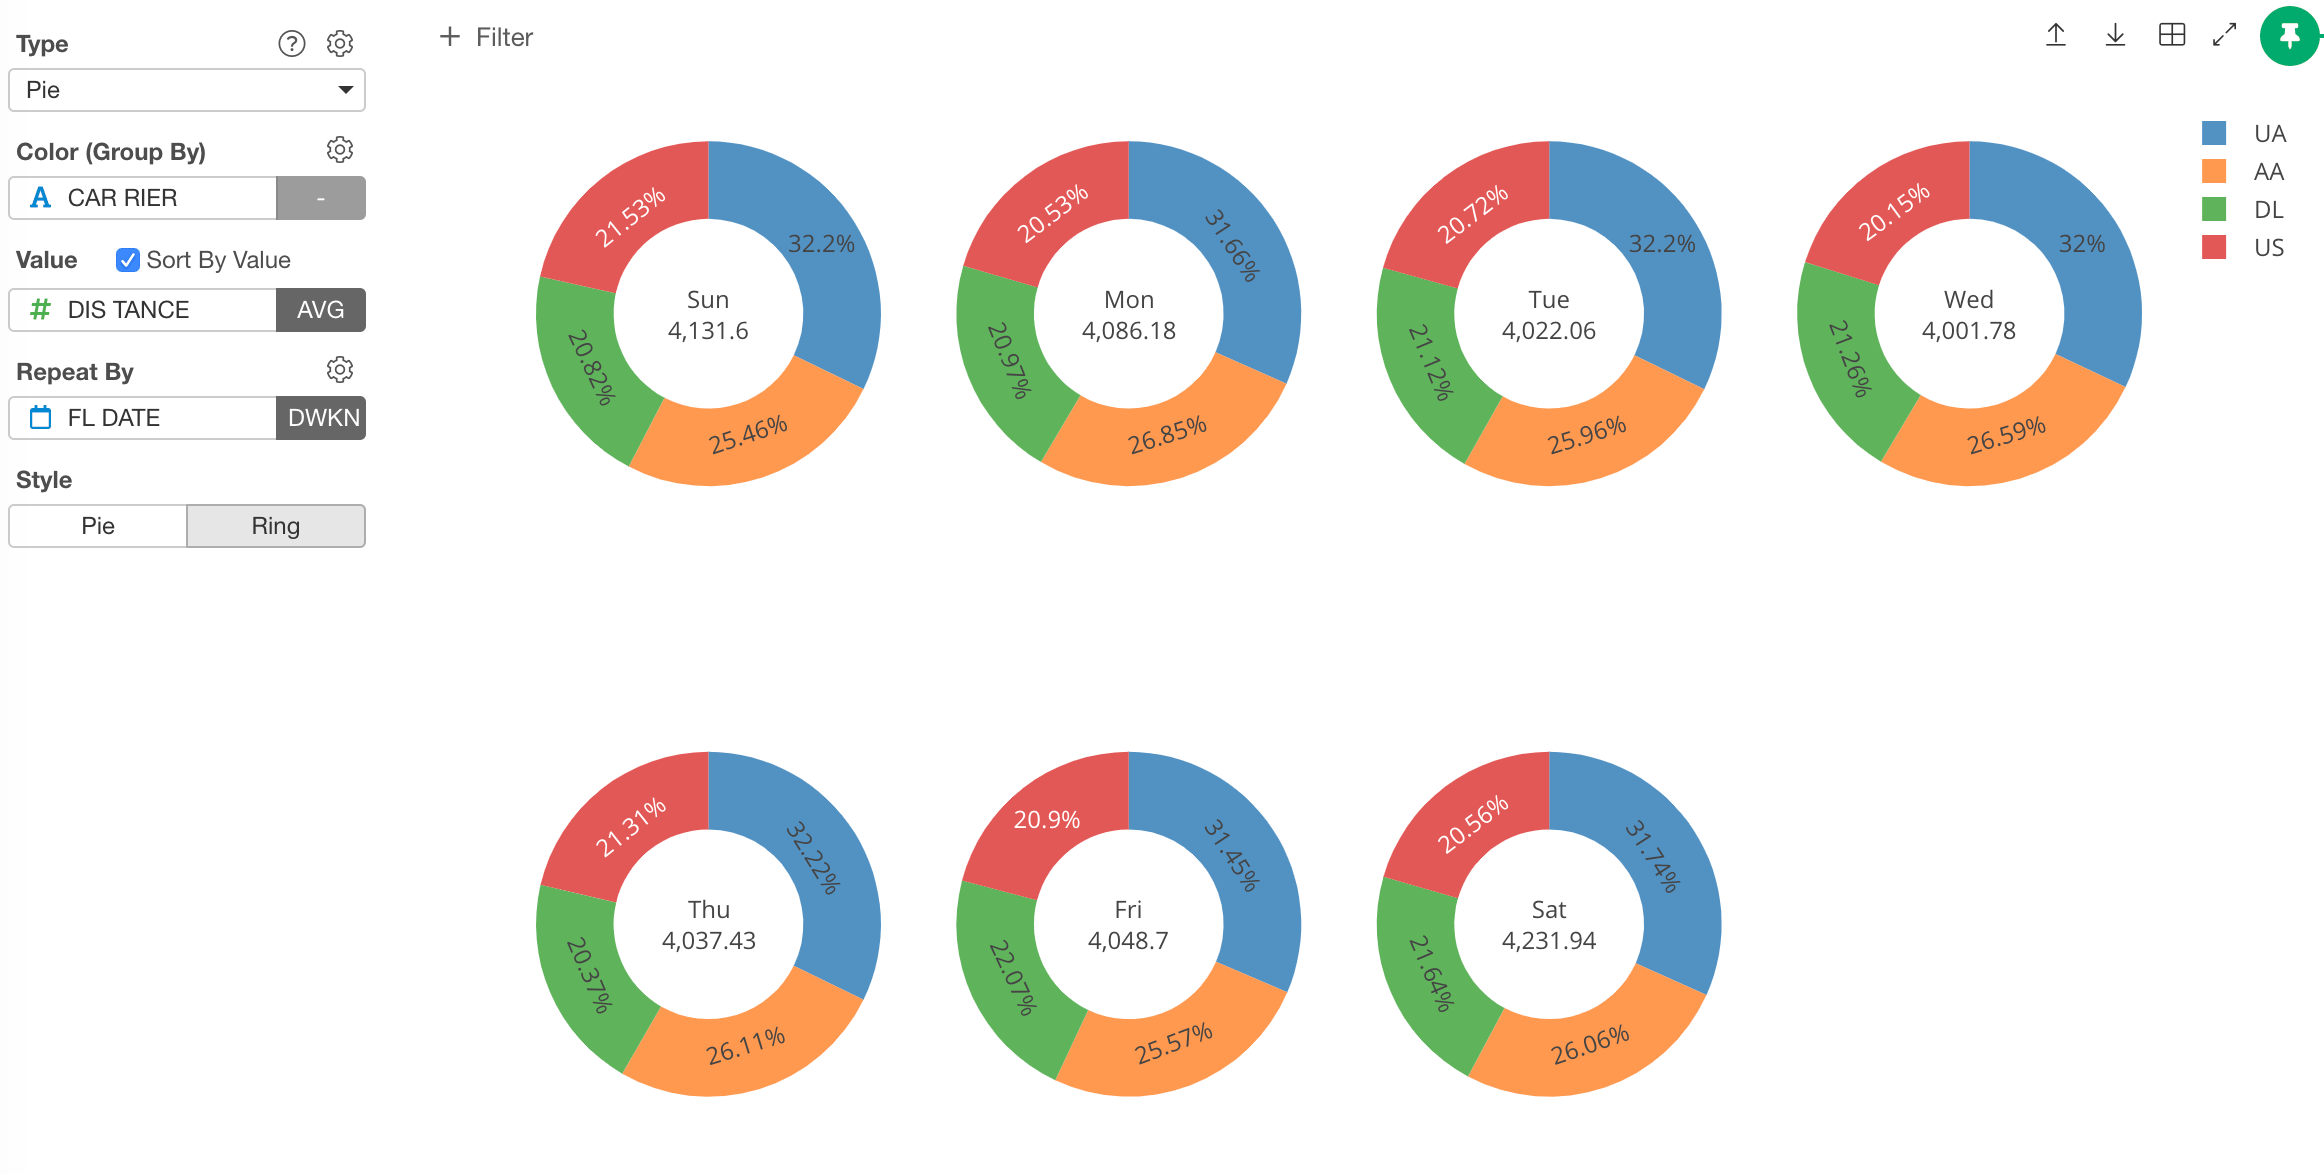
Column Assignments
- Color - Assign a column for groups. Take a look at Color section for more details.
- Value - Assign a data column you want to visualize and compare. The column data should be numeric.
- Sort By Value - If you check it, the color sort is based on the size of the values. If you uncheck it, the color sort is based on the data. If you assign a character column, it will be in an alphabetical order. If you assign a factor column, the order will be in the factor level order.
- Repeat By - You can assign a column to repeat the chart for each of its values. Take a look at Repeat By section for more details.
- Style - You can choose Pie or Ring style.
Highlight
You can change the color of the specific markers such as bars, lines or circles that you pick to stand out from others. See Highlight for the detail.Category
You can categorize numeric values inside the chart. See Category(Binning) for the detail.‘Others’ Group
If you have many categories, you can reduce the number of categories by changing some category names to ‘Others’ using the ‘Others’ Group feature. See ‘Others’ Group for the detail.Custom Function
You can use the Custom Function feature to define your own aggregation function. See Custom Function for the detail.Missing Value Handling
You can use the Missing Value Handling feature to control missing values. See Missing Value Handling for the detail.Show Detail
You can show the detailed data underlying the chart by clicking the chart figure. See Show Detail for the detail.Layout Configuration
- Show Percentages - Show percentage numbers on the plot area.
- Show Values - Show the actual numbers on the plot area.
- Show Labels - Show the category names on the plot area.
- Hole Size - The ratio of the hole size. If you set 0, it becomes a pie chart.