Column Assignments
- Group by - Assign a column you want to group by.
- Longitude - Assign a column that has longitude values. If you assign a column to Group By, you can choose how to aggregate such as sum, average.
- Latitude - Assign a column that has longitude values. If you assign a column to Group By, you can choose how to aggregate such as sum, average.
- Color By - Assign a column for color. If you assign a categorical column, it will be also used as a groupby column. Take a look at Color section for more details.
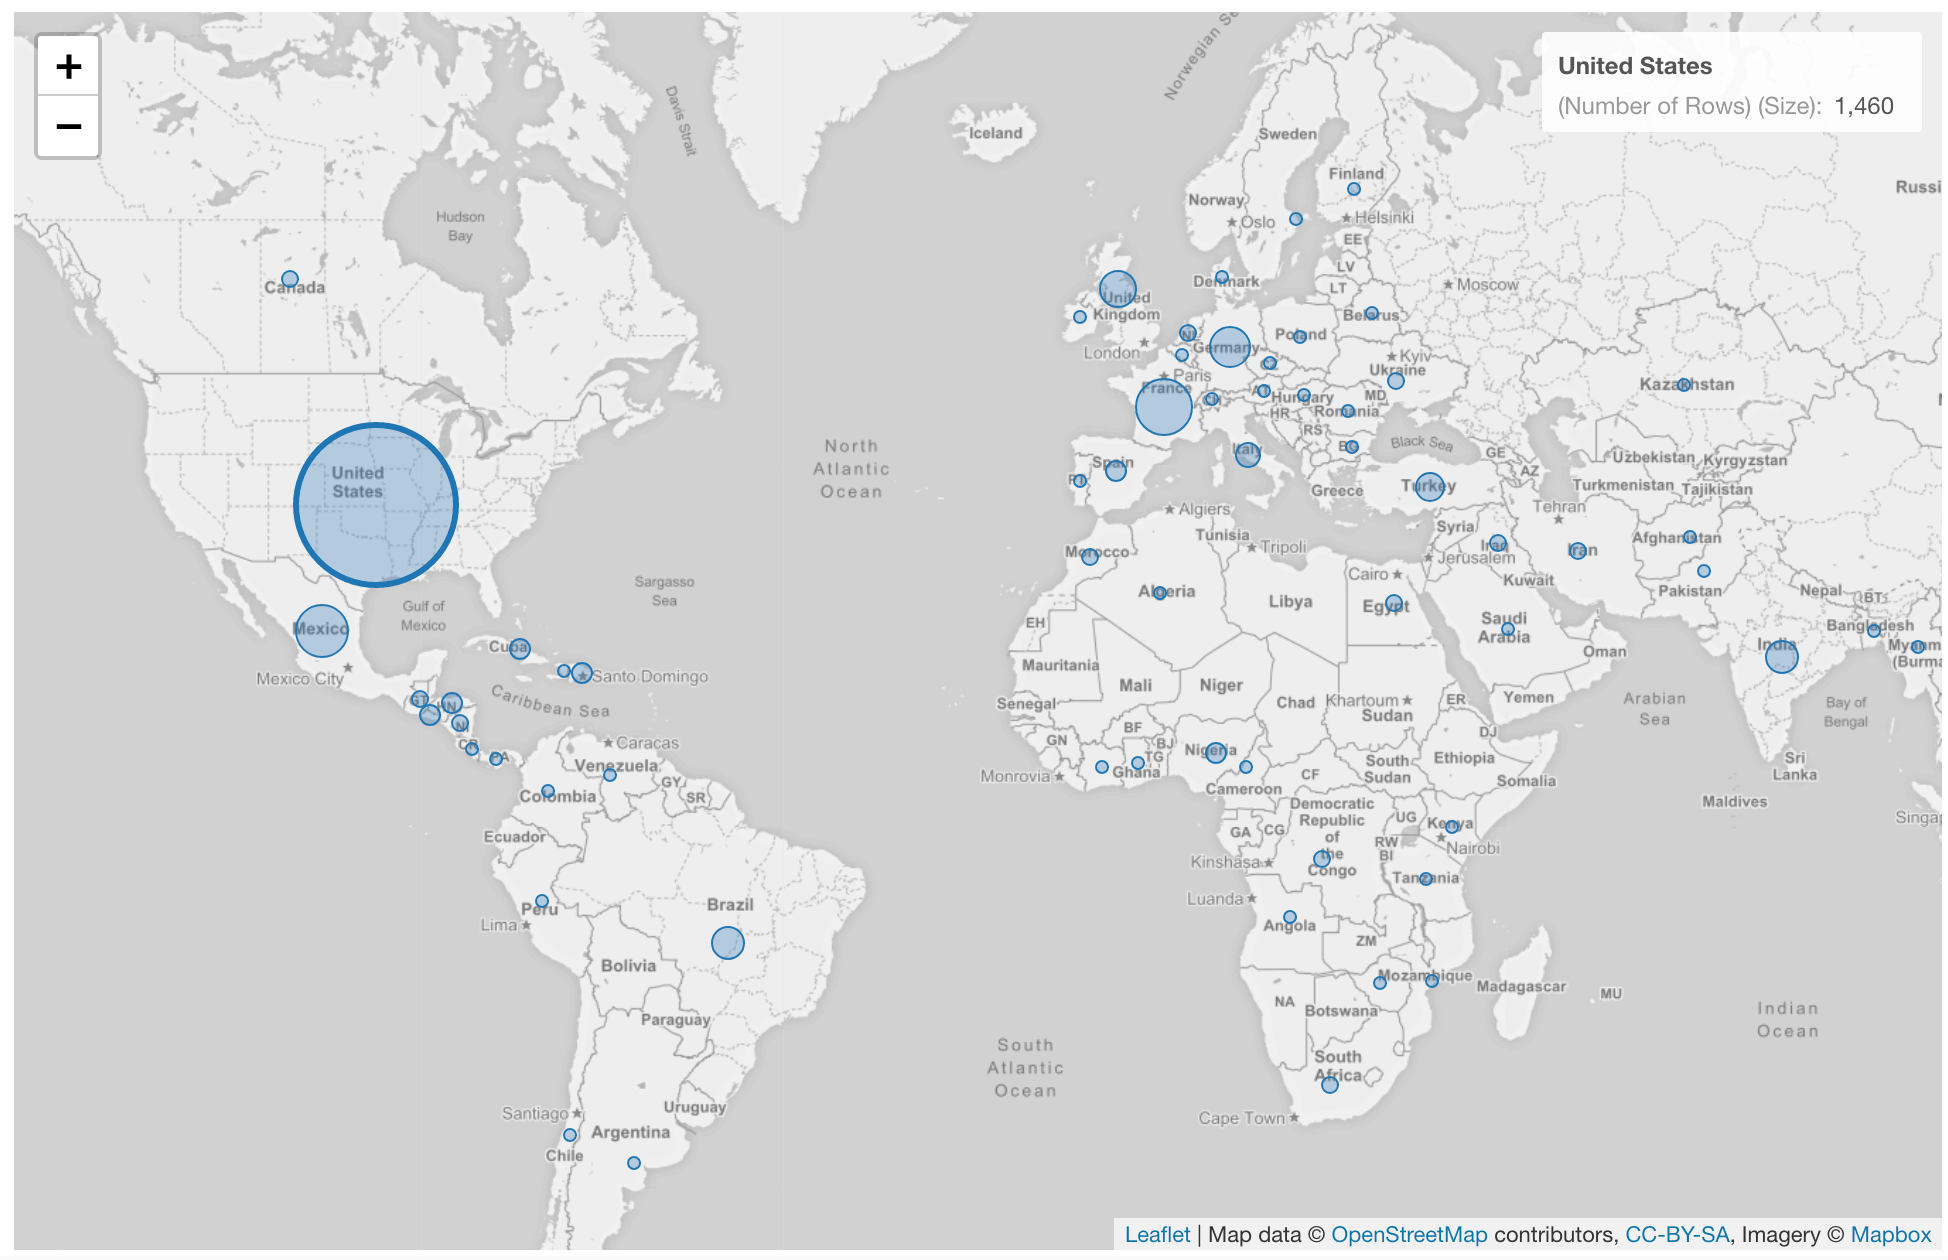
- Size - Assign a column for the circle size.
- Label - Assign a column you want to show in the balloon help that you see when you hover circles on the map.
Highlight
You can change the color of the specific circles that you pick to stand out from others. It is available only when you assgin a categorical column to color. See Highlight for the detail.Category
You can categorize numeric values inside the chart. See Category(Binning) for the detail.Missing Value Handling
You can use the Missing Value Handling feature to control missing values. See Missing Value Handling for the detail.Custom Function
You can use the Custom Function feature to define your own aggregation function. See Custom Function for the detail.Connecting dots by lines
You can connect dots by lines by setting a marker to either “Circle + Line” or “Circle + Dashed Line”. You can change the marker from the Size Setting dialog.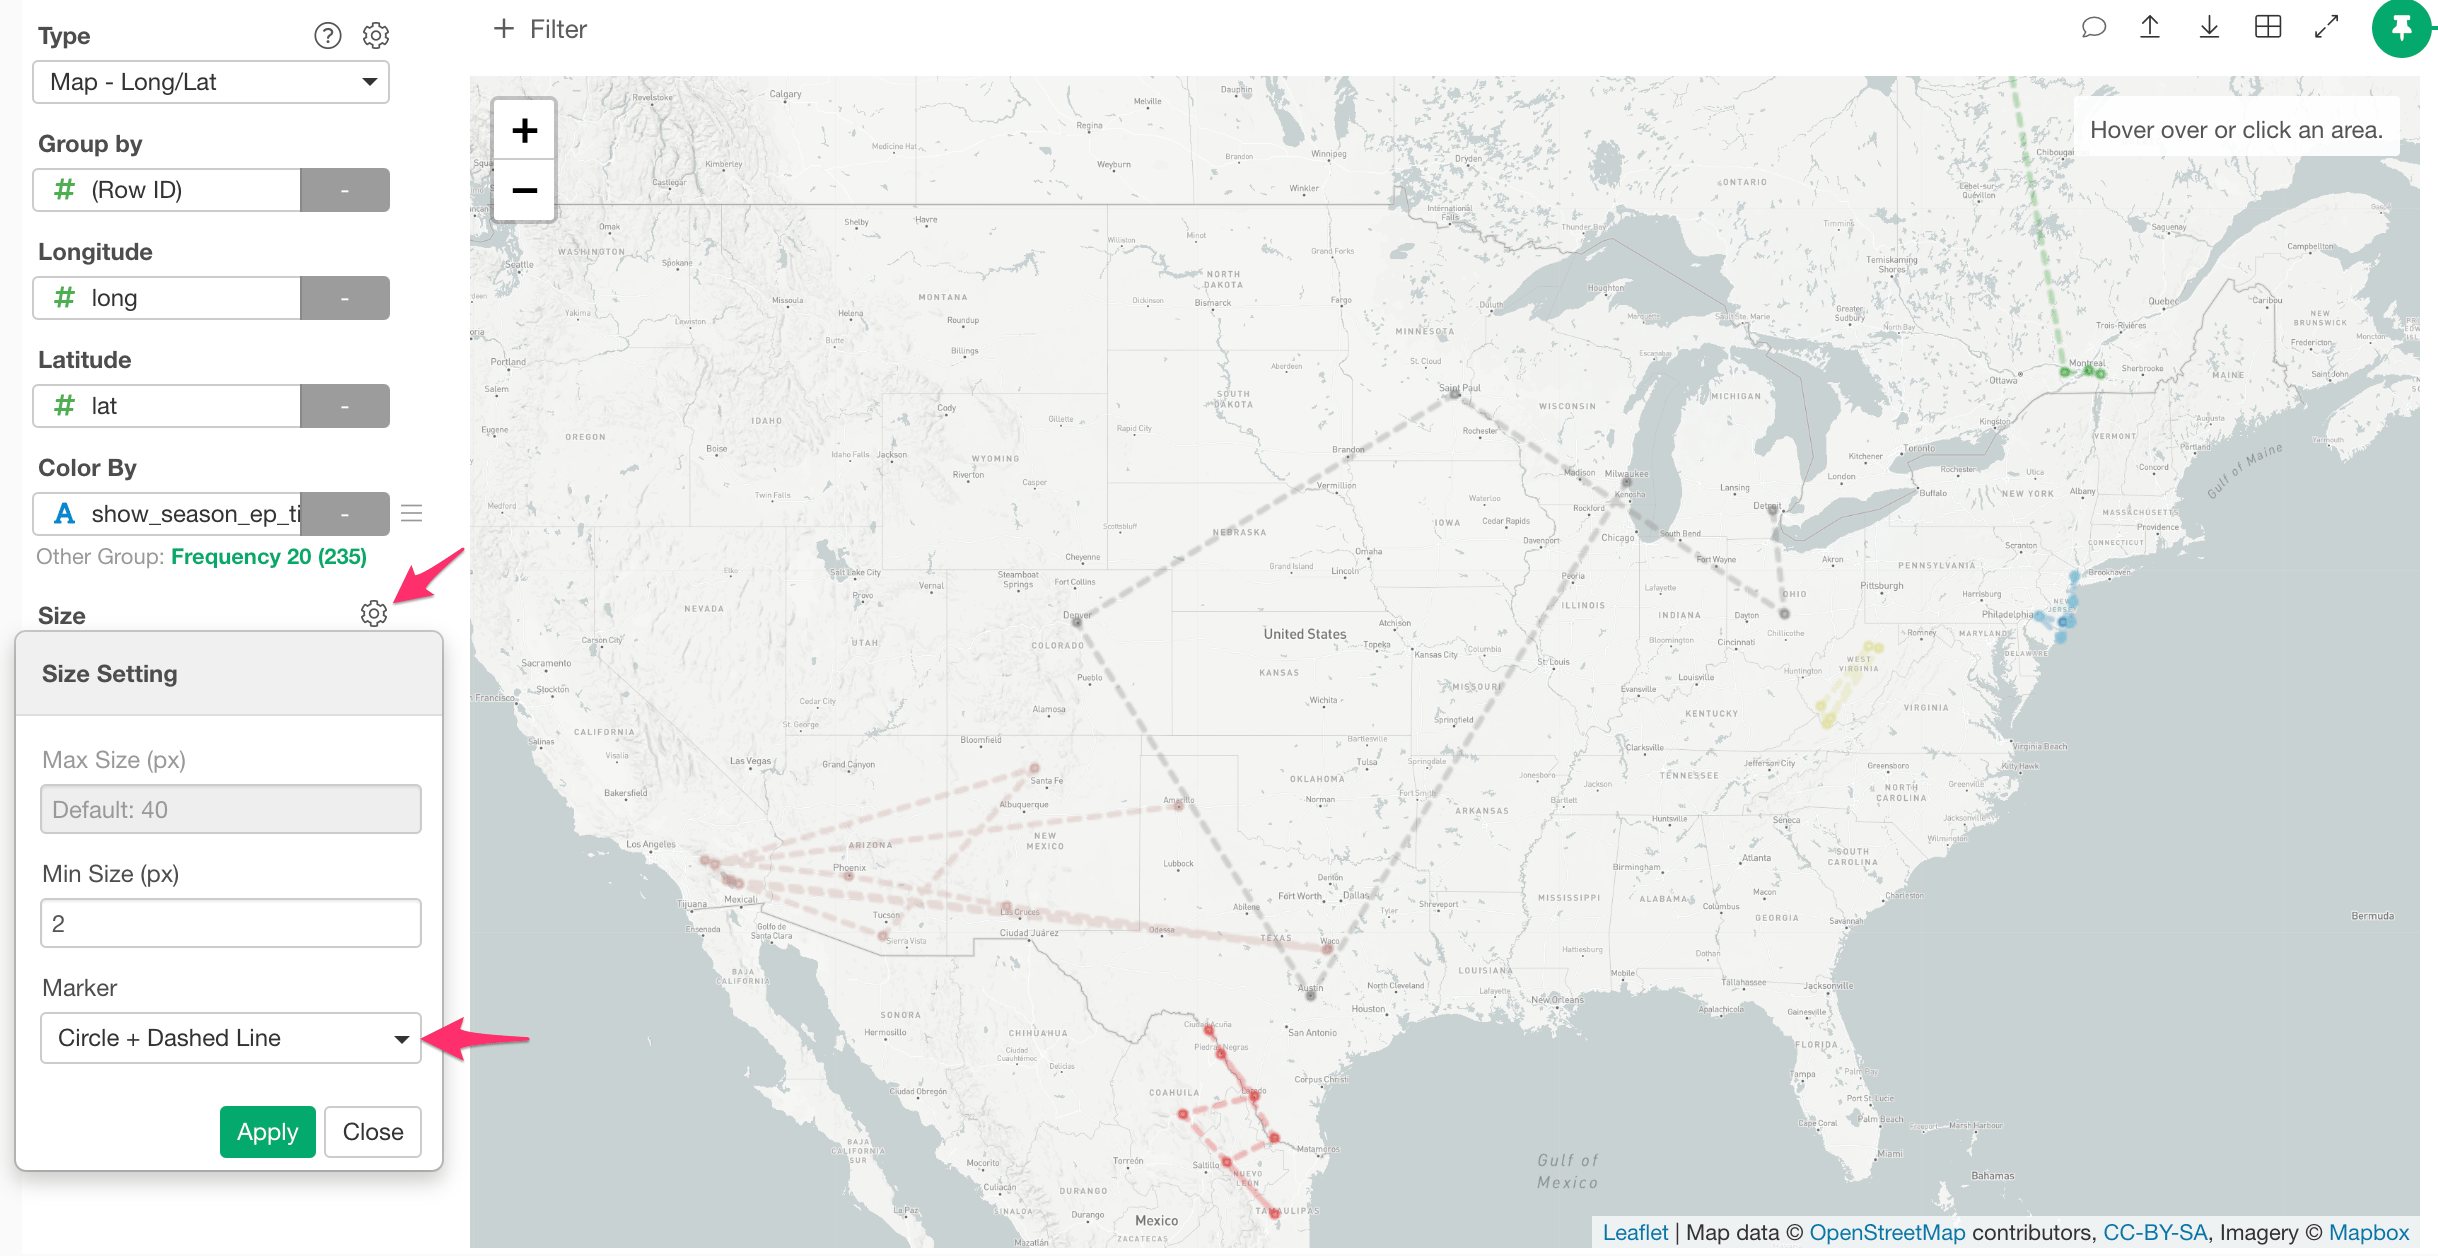
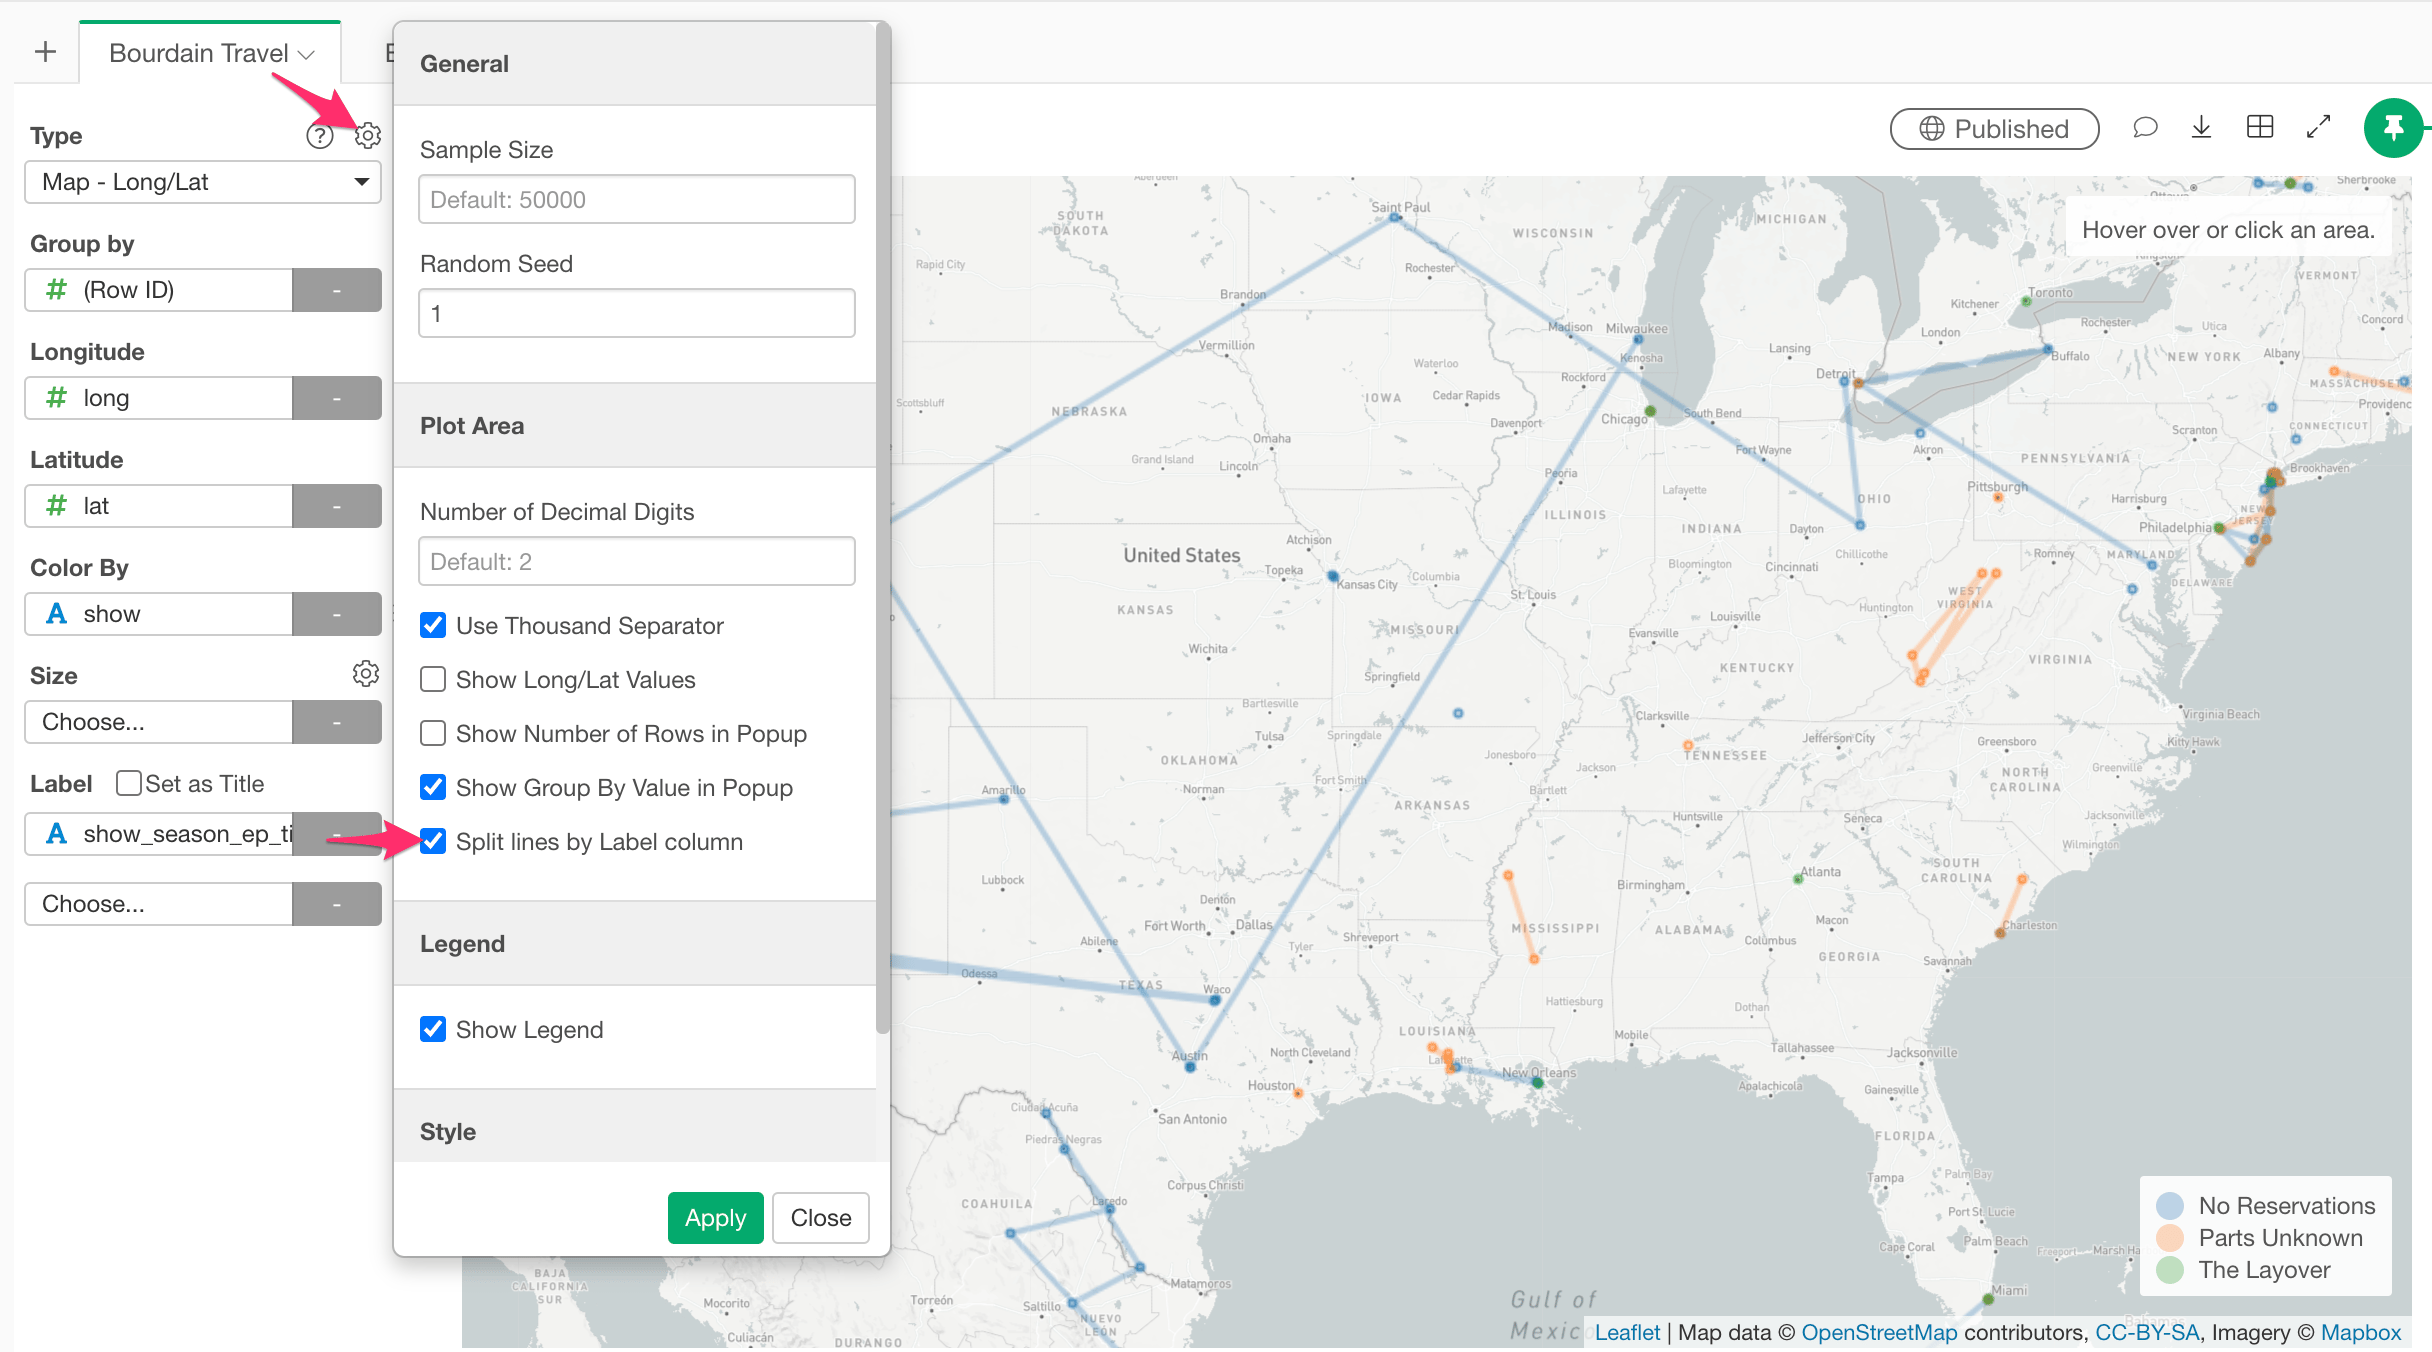
Split lines by the Label column
You can split the lines even in the same color by setting a grouping column to the ‘Label’ and enabling the ‘Split lines by Label column’ option in the property.