
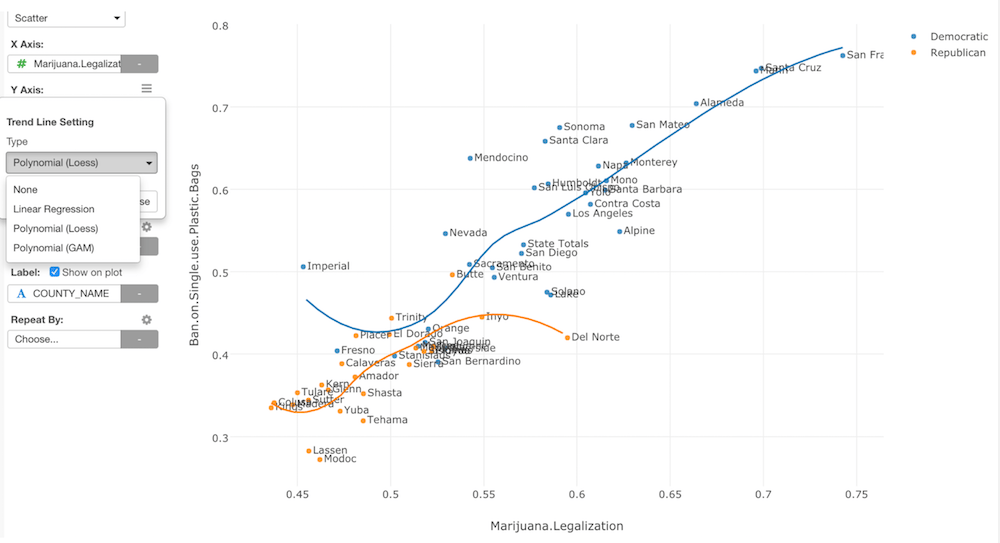
Column Assignments
- X-Axis - Assign a column you want to show at X-Axis. If it is a date / time column assigned, the axis will be automatically in time series. If it is a number based column, the axis will be for the continuous values. If it is a text based column, the axis will be for discrete values.
- Y-Axis - Assign a column you want to show at Y-Axis. The assigned column is handled in the same way as X-Axis.
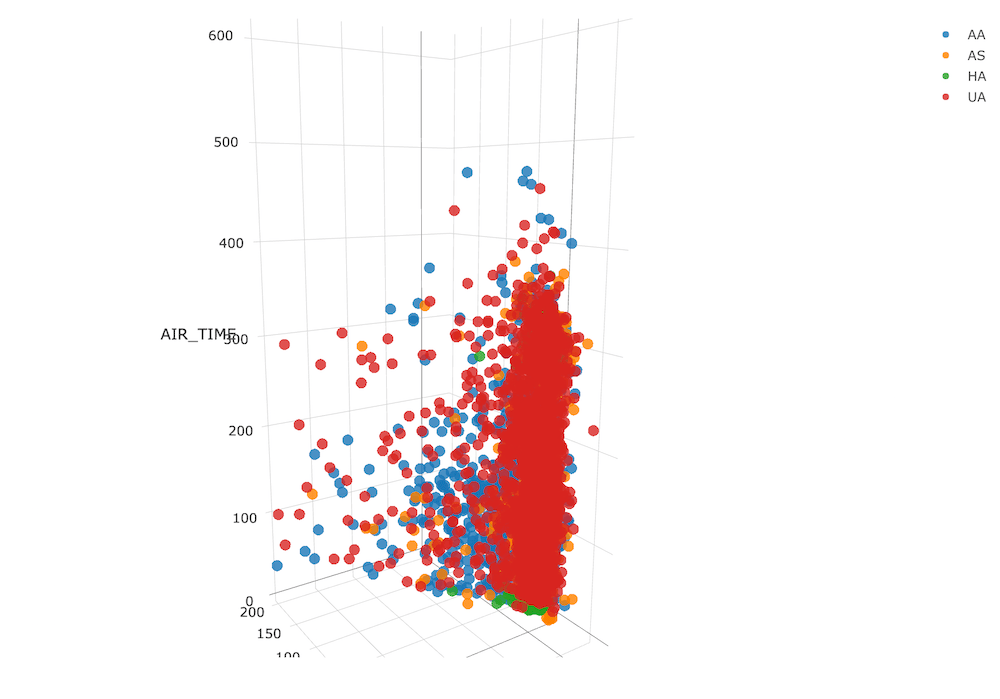
- Z-Axis - Assign a column you want to show at Z-Axis. By assigning Z-Axis, the chart becomes 3D Scatter chart. The assigned column is handled in the same way as X-Axis. Note that on Windows with some hardware and driver, 3D scatter chart may not work. In that case, you can install DirectX 9 redistributable to make it work.
- Size - Assign a column you want to apply the size on each circle. You can assign a number based column only.
- Color - Take a look at Color section for more details.
- Label - Assign a column you want to show in the balloon help that you see when you hover the marker such as dots.
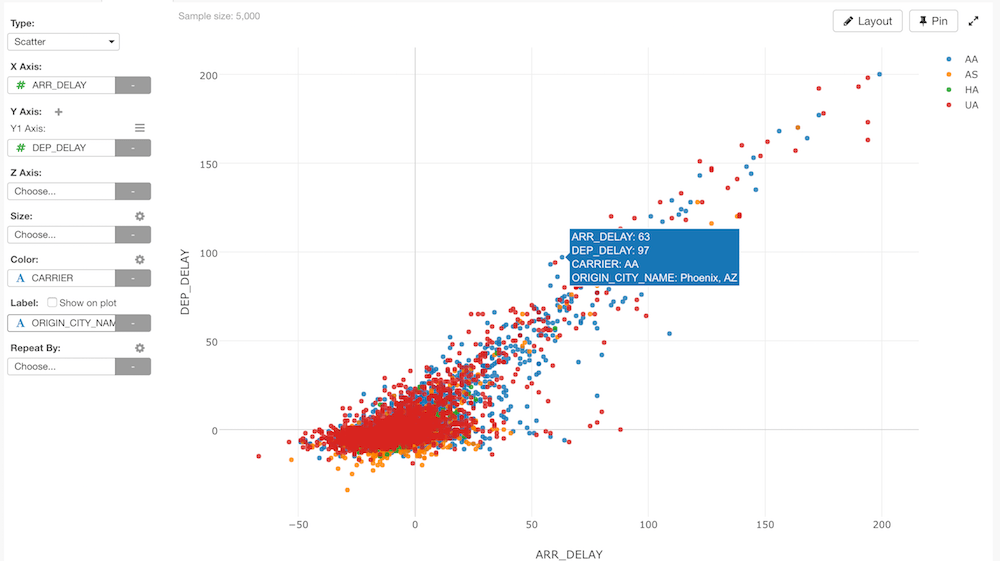
Show on plotoption, the column values directly come up in the plot area.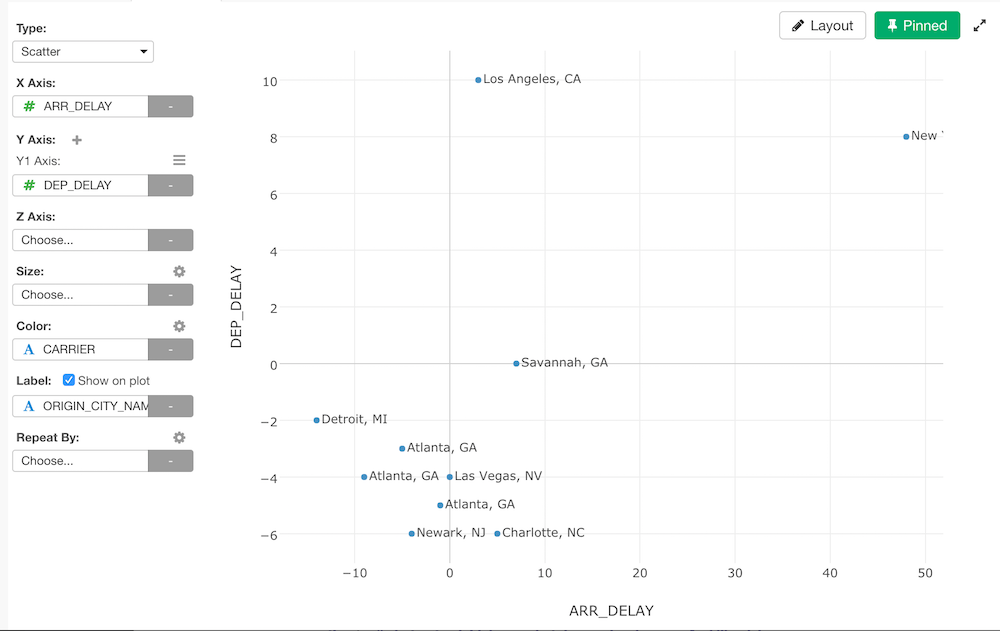
- Repeat By - You can assign a column to repeat the chart for each of its values. Take a look at Repeat By section for more details.
Trend Line
Take a look at Trend Line section for more details.Reference Line
Take a look at Reference Line section for more details.Range
Take a look at Range section for more details.Circle for Color
You can draw circles for each color group. It is useful to see the distributions of each group. You can access the Circles for Color feature from the Color property dialog that you can access by clicking the gear icon at the Color control.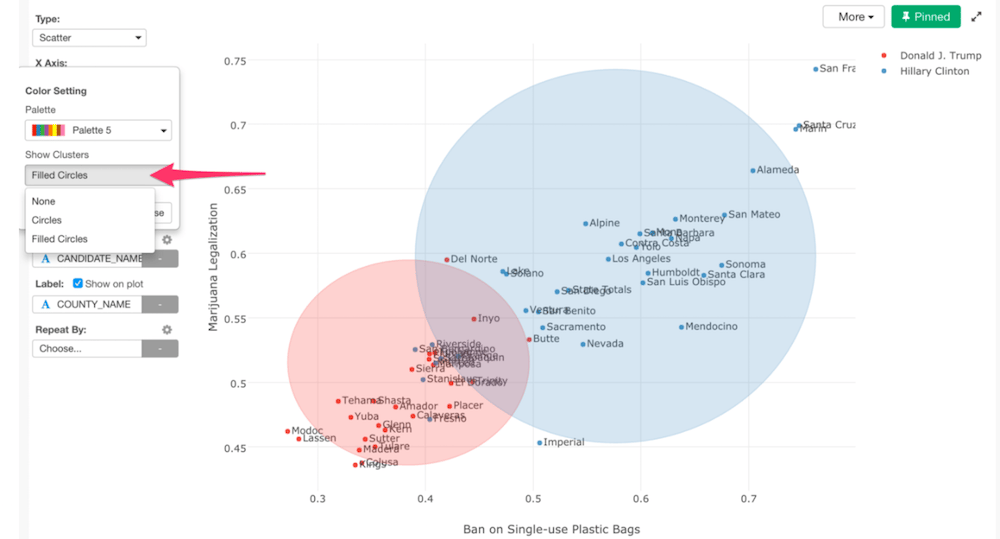
- Circles - Circles without fill colors
- Filled Circles - Circles filled with colors