
You can create an Error Bar chart with this data by following steps.
- Create a new chart and select “Error Bar (Summarized Data)” Type.
- Select “Ratio” for the Calculation Type.
- Assign “Date” to X Axis.
- Assign “Convertion” to Y Axis.
- Assign “Total Views” to Total Number.
- Select “Circle” for the Marker.
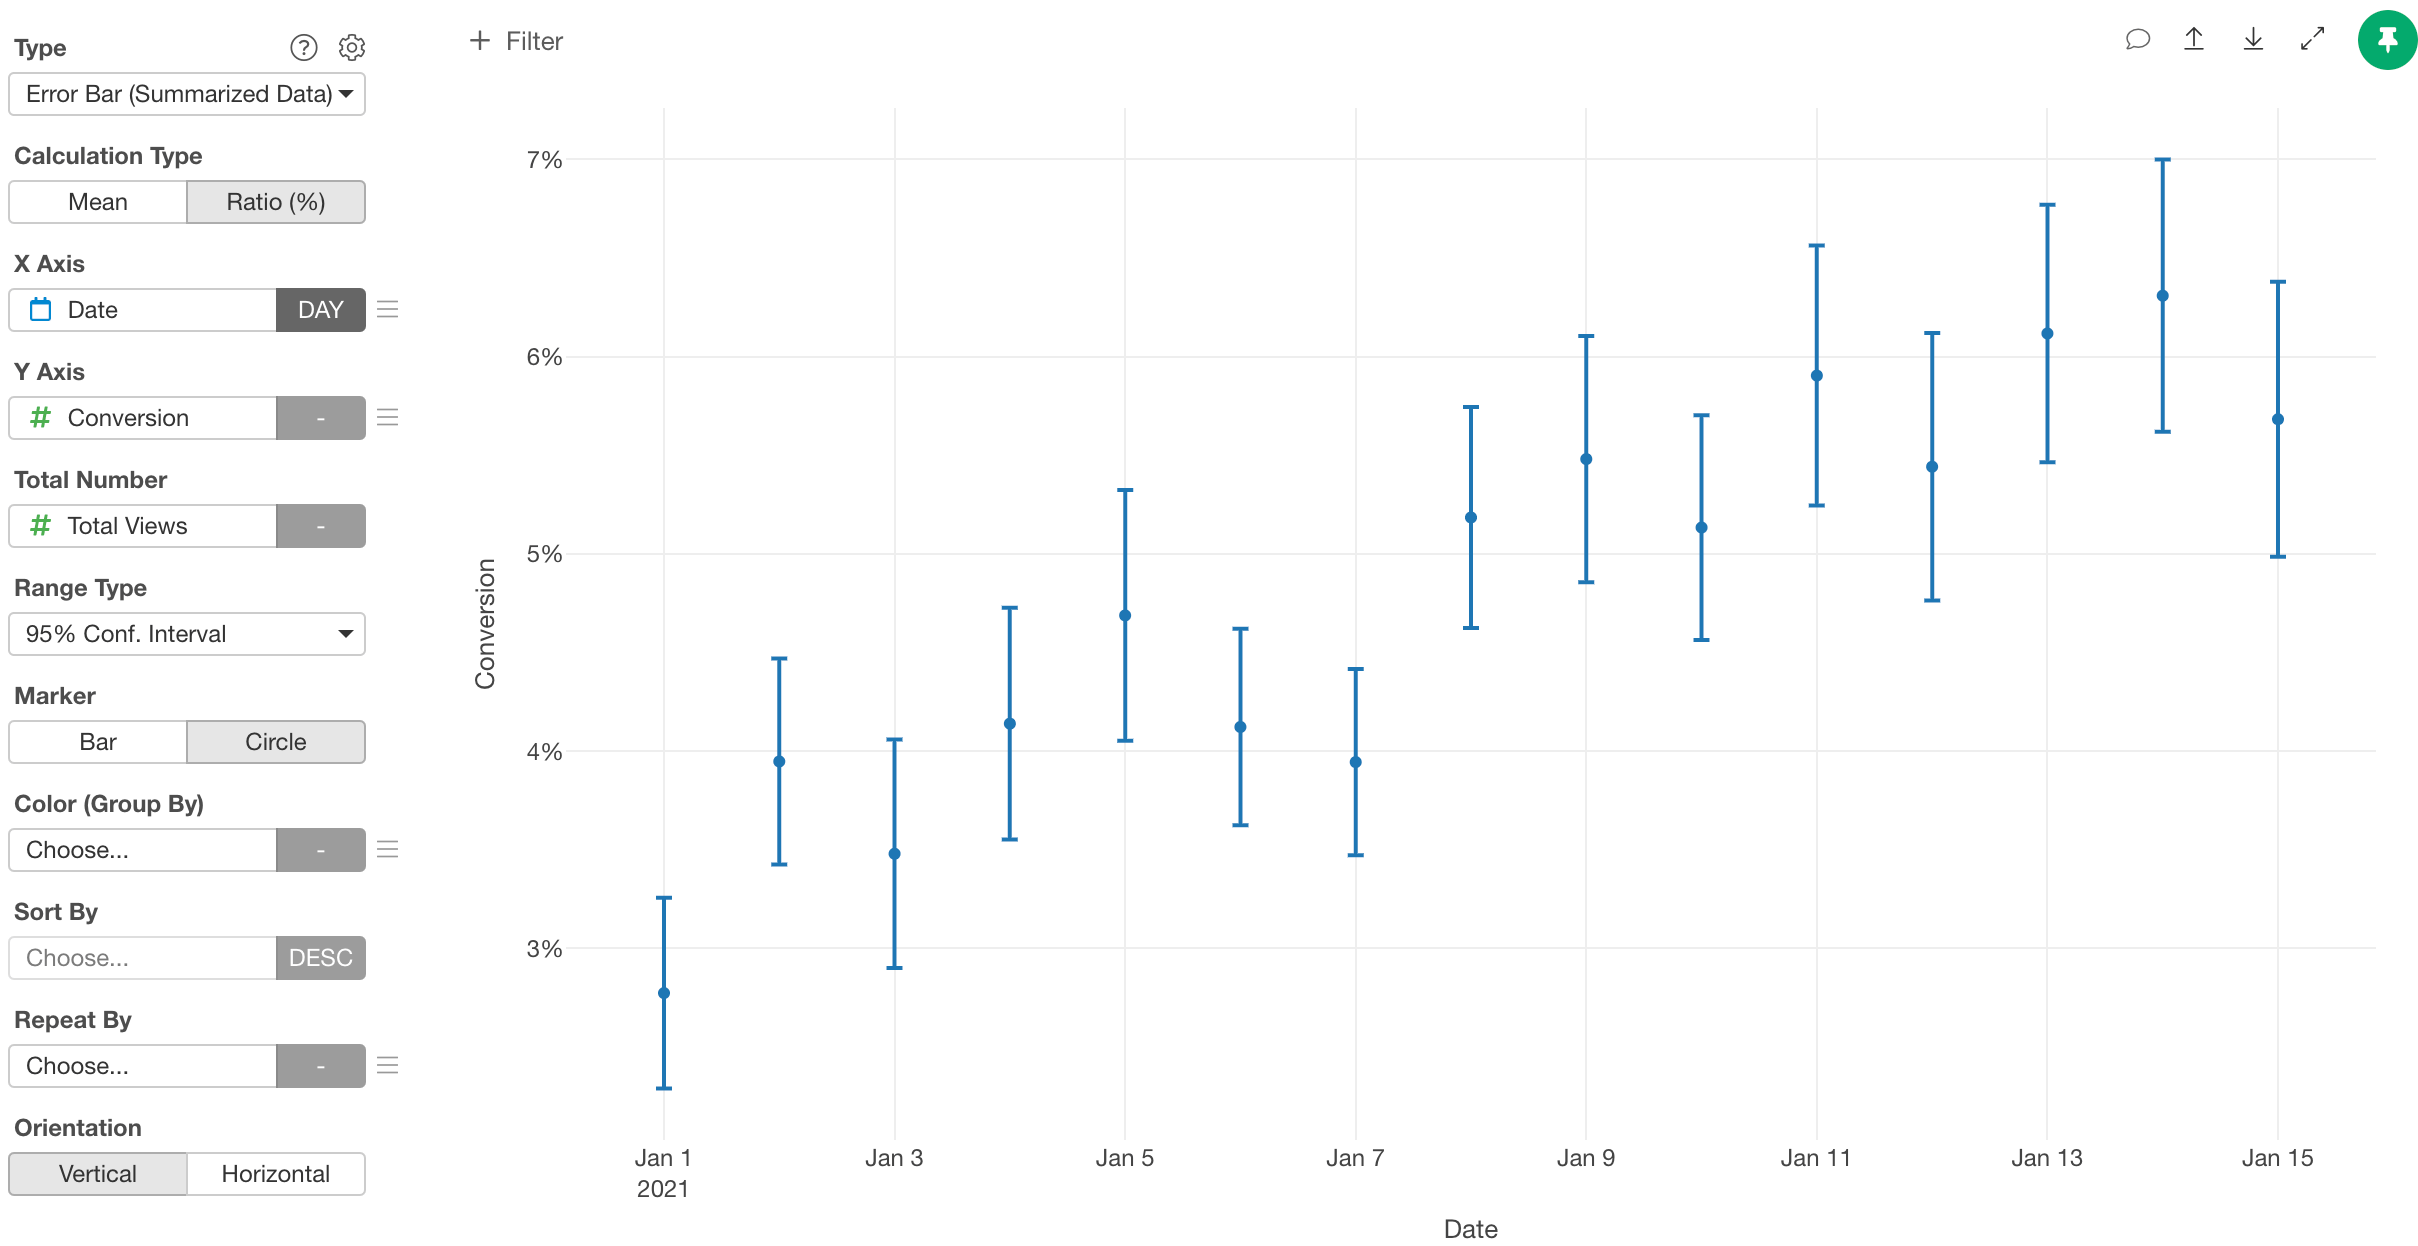
Assignments
- Calculation Type - You can select an error bar calculation type from the following options. The default is
Mean.- Mean - Average based error bar chart.
- Ratio (%) - Ratio based error bar chart based on the count of values.
- X-Axis - Assign a column you want to show at X-Axis. If it’s a Date / Time column assigned, you can select the aggregation level such as
Month,Week,Day, etc. If you assign a Number column, you can choose eitherAs Numberto treat values as continuous values orAs Textto treat values as categorical values. - Y-Axis - Assign a column you want to show at Y-Axis.
- If the calculation type is
Mean, assgin the mean value of each group. - If the calculation type is
Ratio (%), assign the target count of each group.
- If the calculation type is
- Total Number - Assign a column that contains the total number of each group.
- Standard Deviation - Assign a column that contains the standard deviation of each group. Only for the “Mean” Calculation Type.
- Range Type - You can select an error bar range type from the following options. The default is
95% Confidence Interval.- 90% Confidence Interval
- 95% Confidence Interval
- 99% Confidence Interval
- Marker - You can select a marker type from the following options. The default is
Bar.- Bar - Suitable for comparing actual values and error bar ranges.
- Circle - Suitable for comparing error bar ranges.
- Color - Take a look at Color section for more details.
- Sort By - Assign a column to use for Sorting the X-Axis values. The default is based on either the alphabetic order or the factor level order for Factor type columns.
- Repeat By - You can assign a column to repeat the chart for each of its values. Take a look at Repeat By section for more details.
- Orientation - You can choose a chart orientation. Either ‘Vertical’ or ‘Horizontal’.
Confidence Interval Range Calculation Formula
Calculation Type: Mean
Formula in R.Calculation Type: Ratio (%)
Formula in R.Reference Line
Take a look at Reference Line section for more details.Style
You can change the error bar styles from the “Style” setting at Y-Axis. You can change the followings.- Line Width: Thickness of the error bars.
- Circle Size: Size of the circle. Available only for “Circle” marker option.
- Horizontal Bar Width: Length of the horizontal bar part of the error bars.