
How to Access This Feature
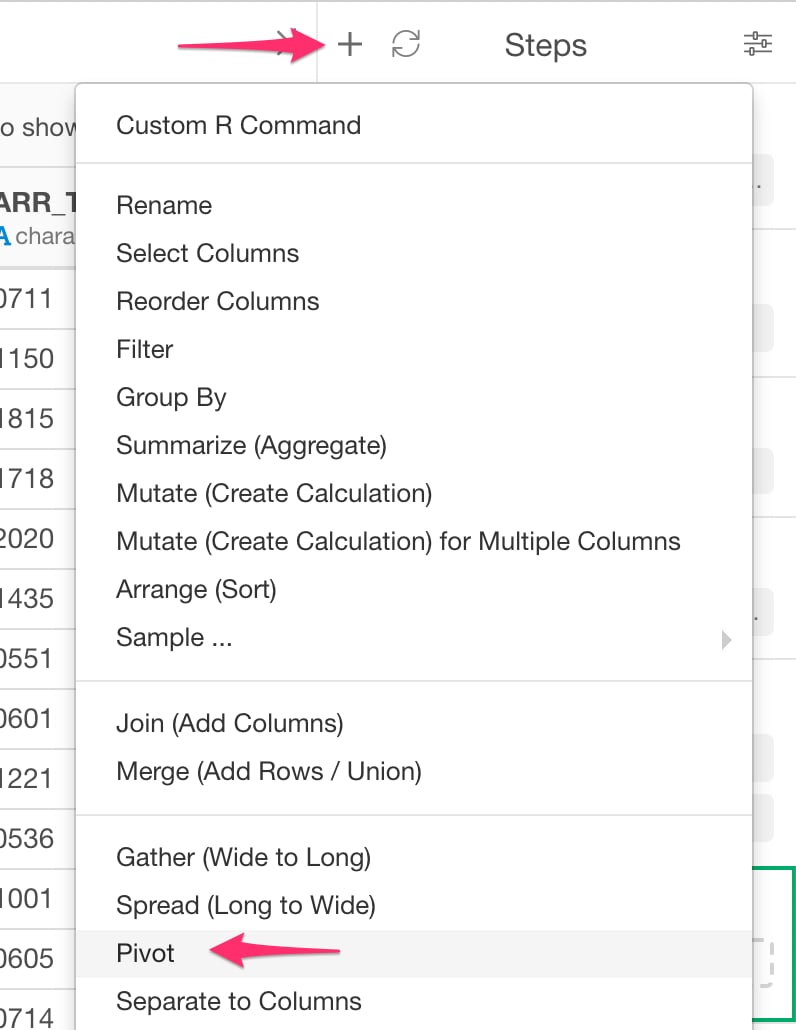
- Click ”+” button and select “Pivot”
From Column Menu
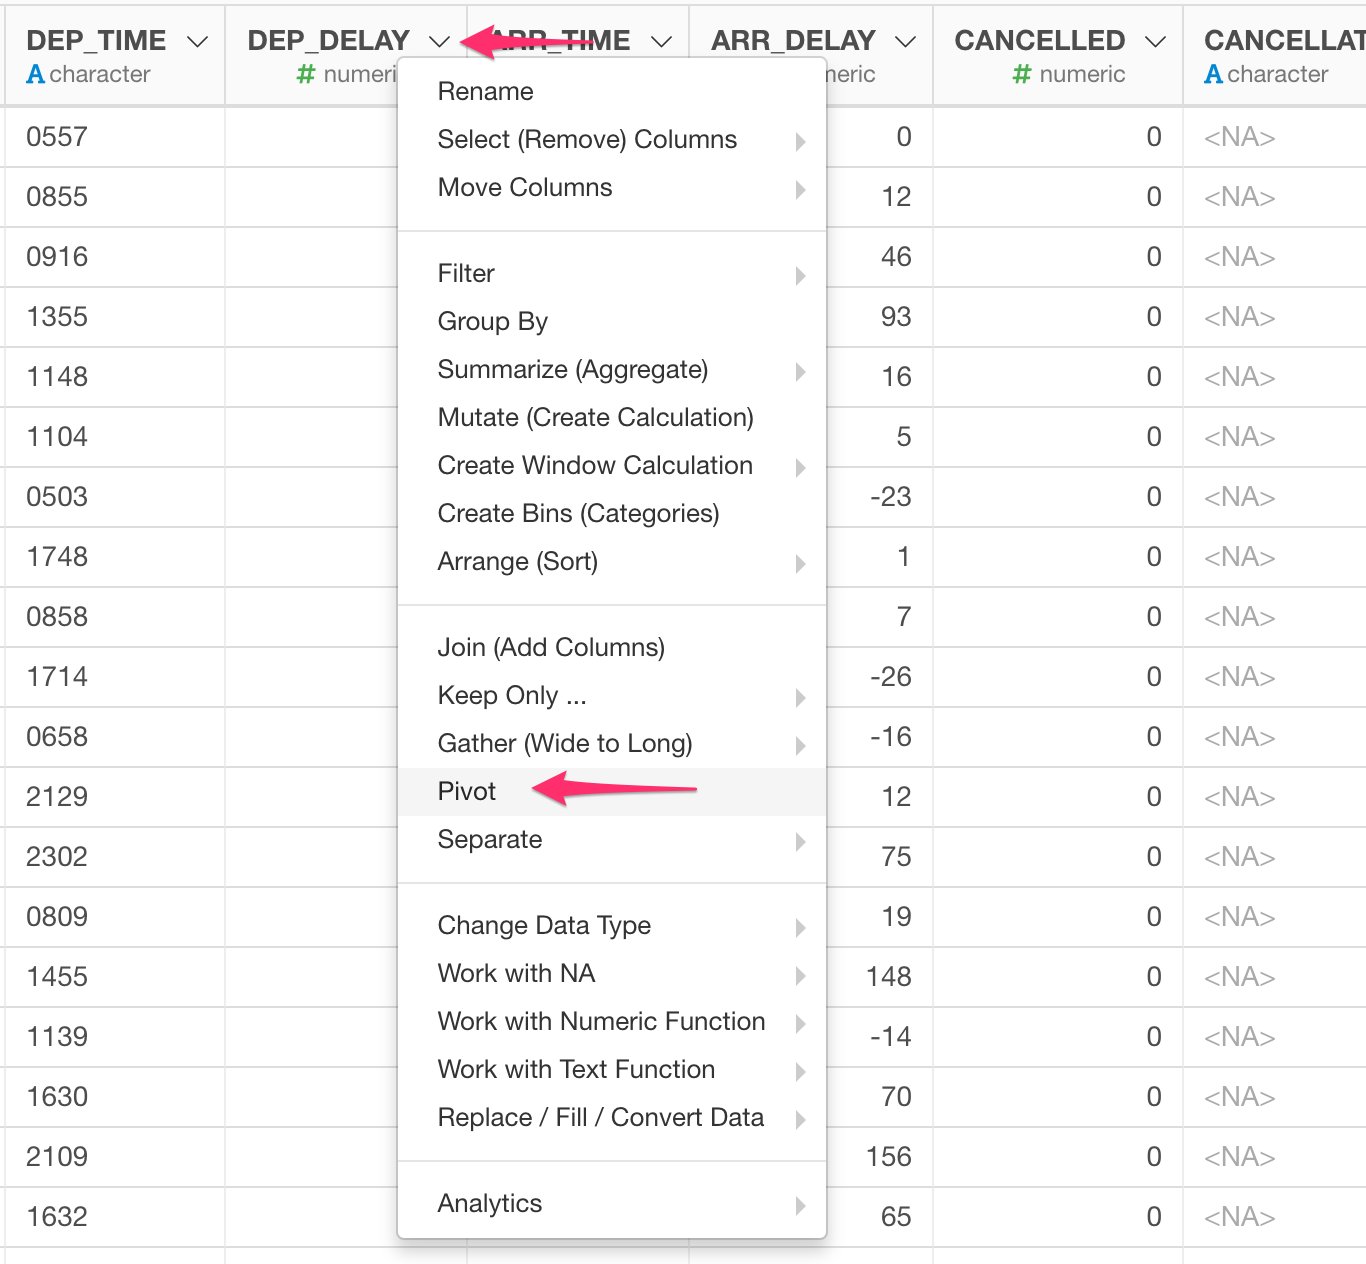
- You can also select “Pivot” from column menu of the column you want to pivot.
Pivot
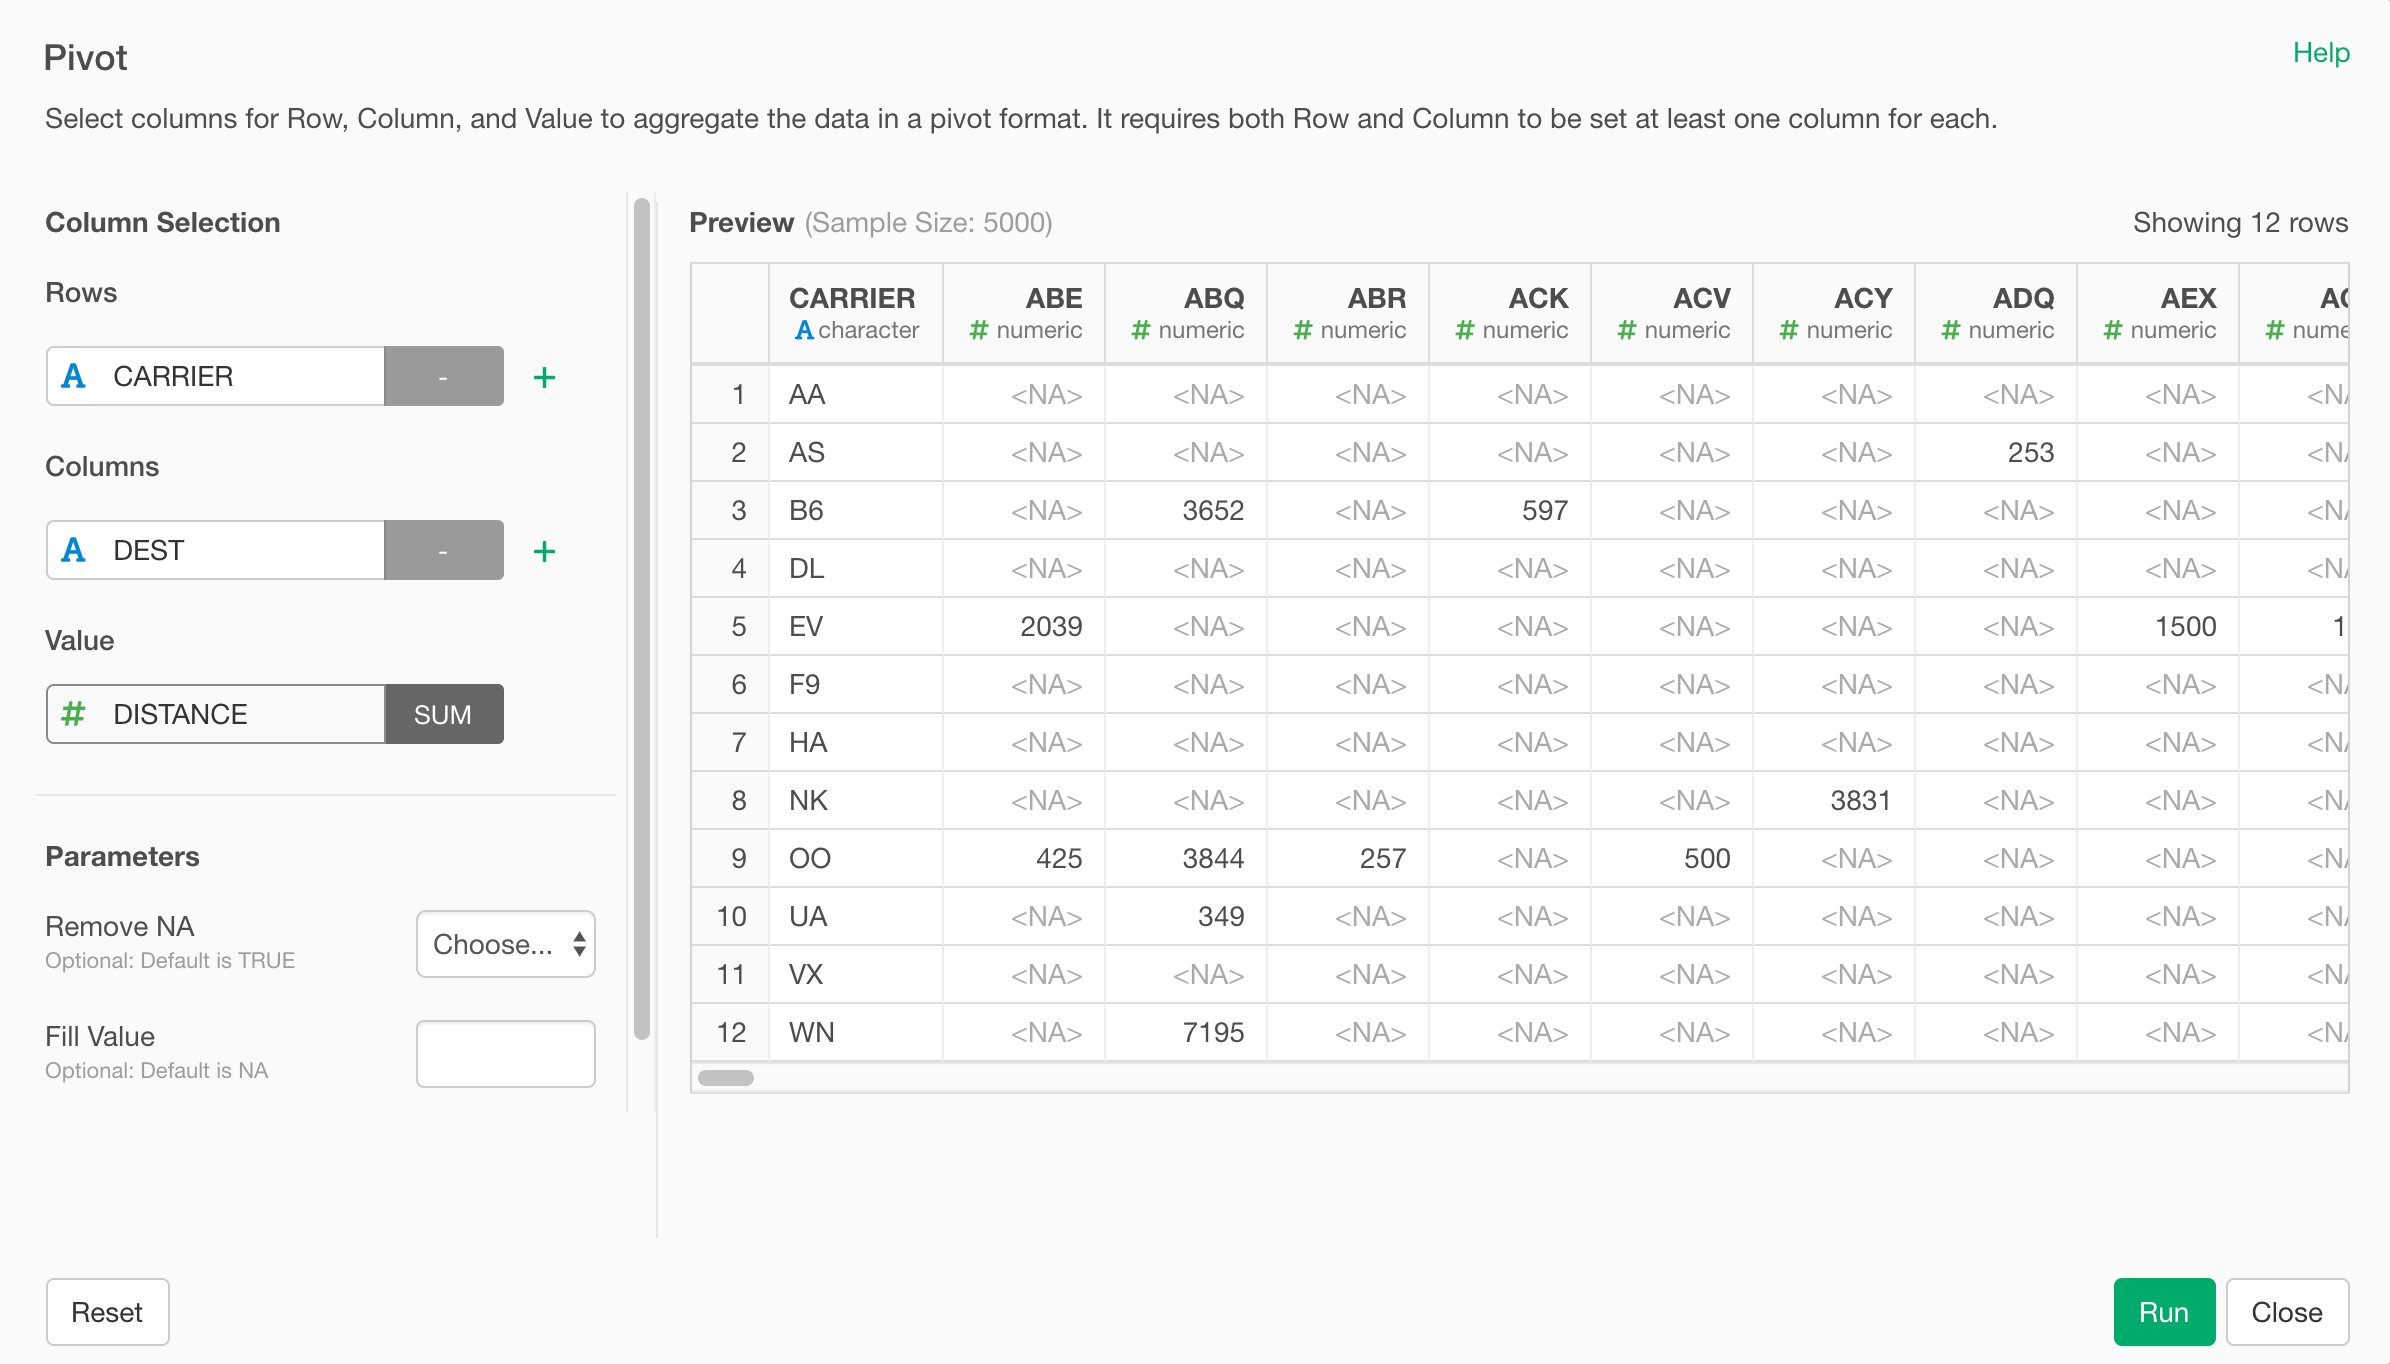
Rows- select columns for Pivot Row.Columns- select colums for Pivot Columns.Value(Optional) - A column for values in output data frame.
Parameters
- Remove NA - The default is TRUE. If NA should be removed from value.
- Fill NA with - The default is 0. This is what should be used for missing value in groups.
Original data:
| clarity | certification | colour | price |
|---|---|---|---|
| VVS2 | HRD | F | 10796 |
| VS1 | GIA | F | 1551 |
| VS1 | GIA | F | 4291 |
| VVS2 | GIA | F | 5881 |
| VS2 | GIA | H | 4585 |
| VVS2 | GIA | H | 5193 |
if you set row: clarify, colour columns: certification value: price fill:0
it returns data frame with rows of combinations of clarity and colour and with columns of certification. Values are sum of price and missing values are filled by 0.
| clarity_colour | GIA | HRD |
|---|---|---|
| VS1_F | 5842 | 0 |
| VS2_H | 4585 | 0 |
| VVS2_F | 5881 | 10796 |
| VVS2_H | 5193 | 0 |