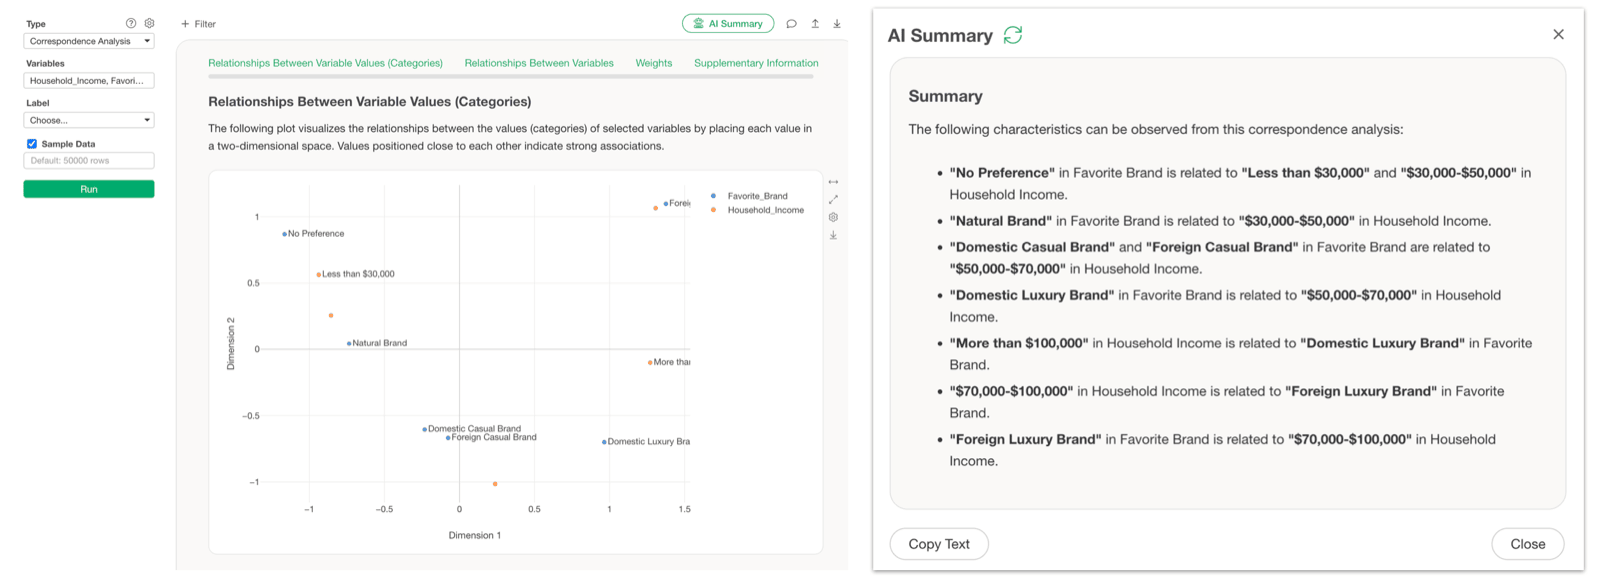
Supported Analytics
- K-Means Clustering
- Factor Analysis
- Correspondence Analysis
- Text Analysis - Word Count
- Text Analysis - Topic Model
Text Analysis - Word Count
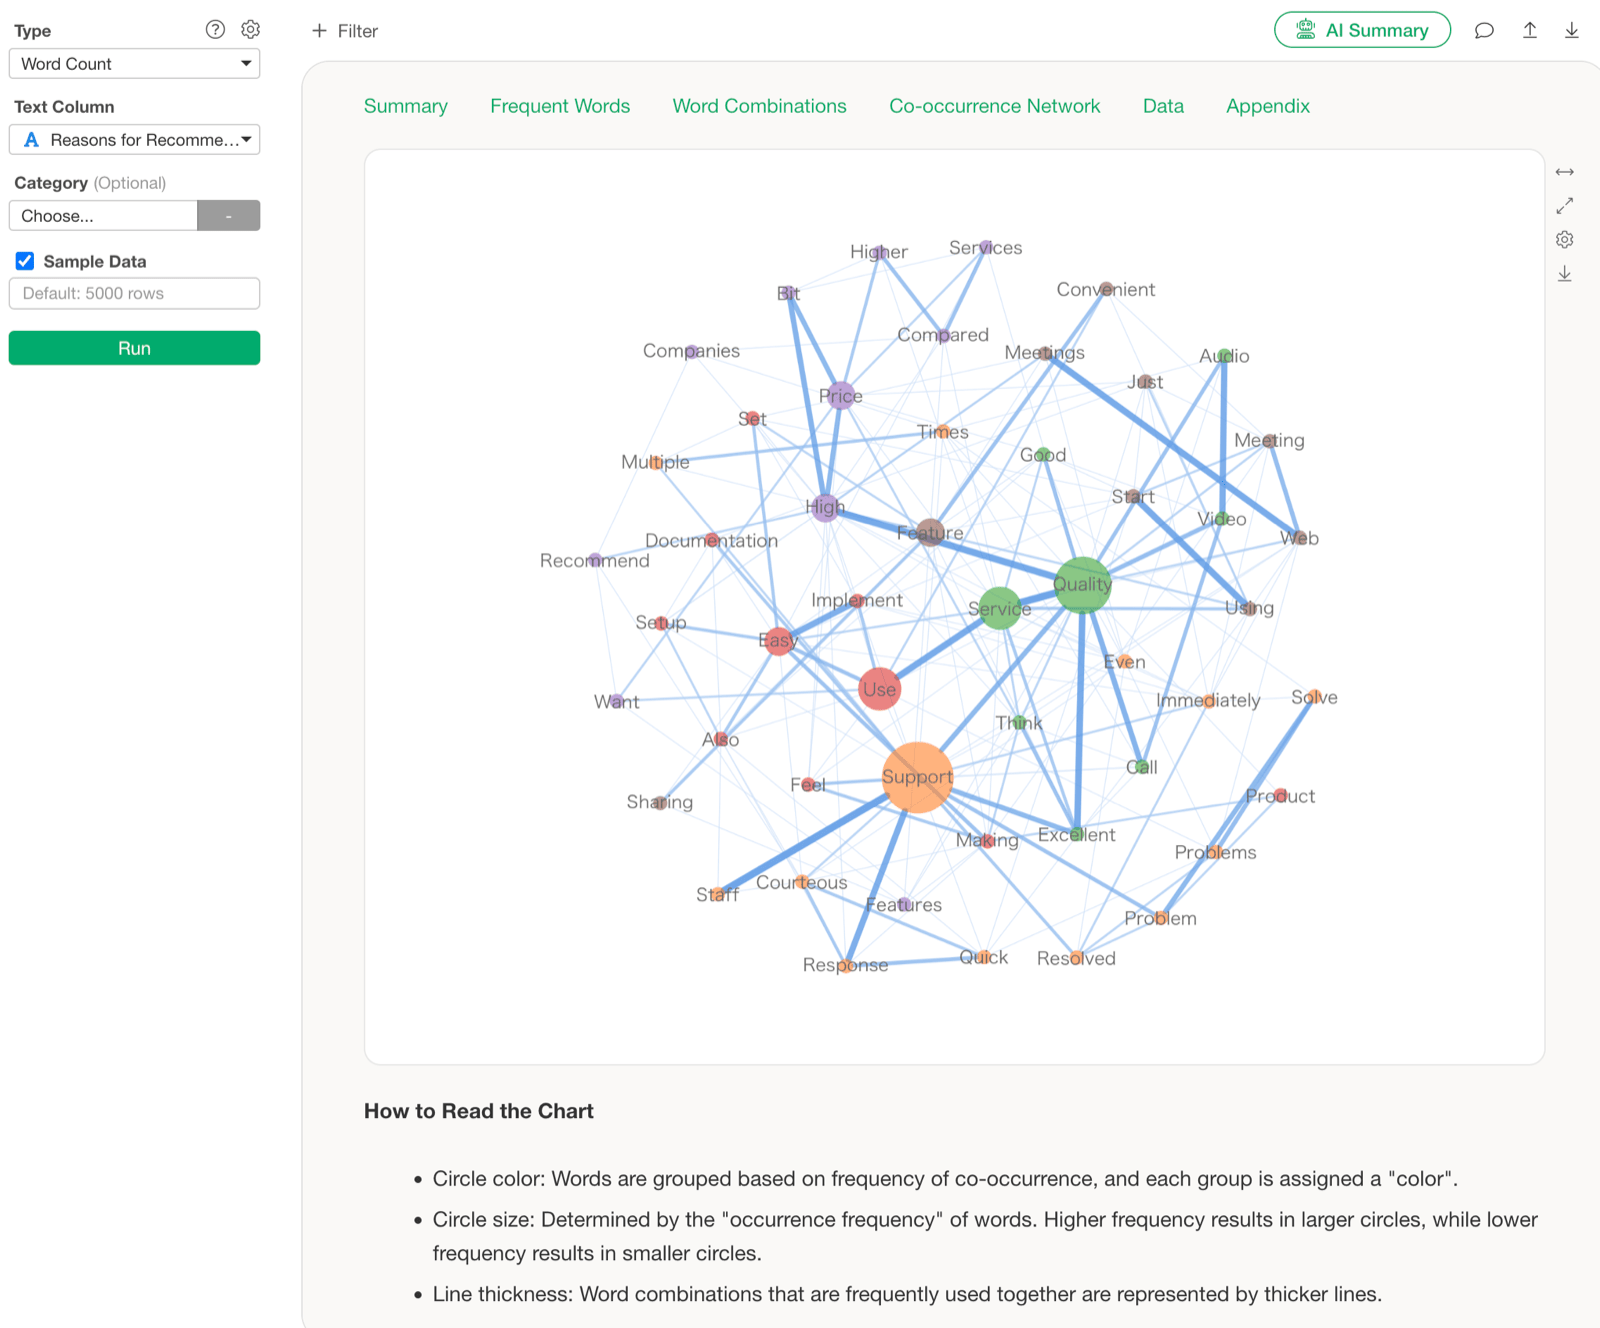
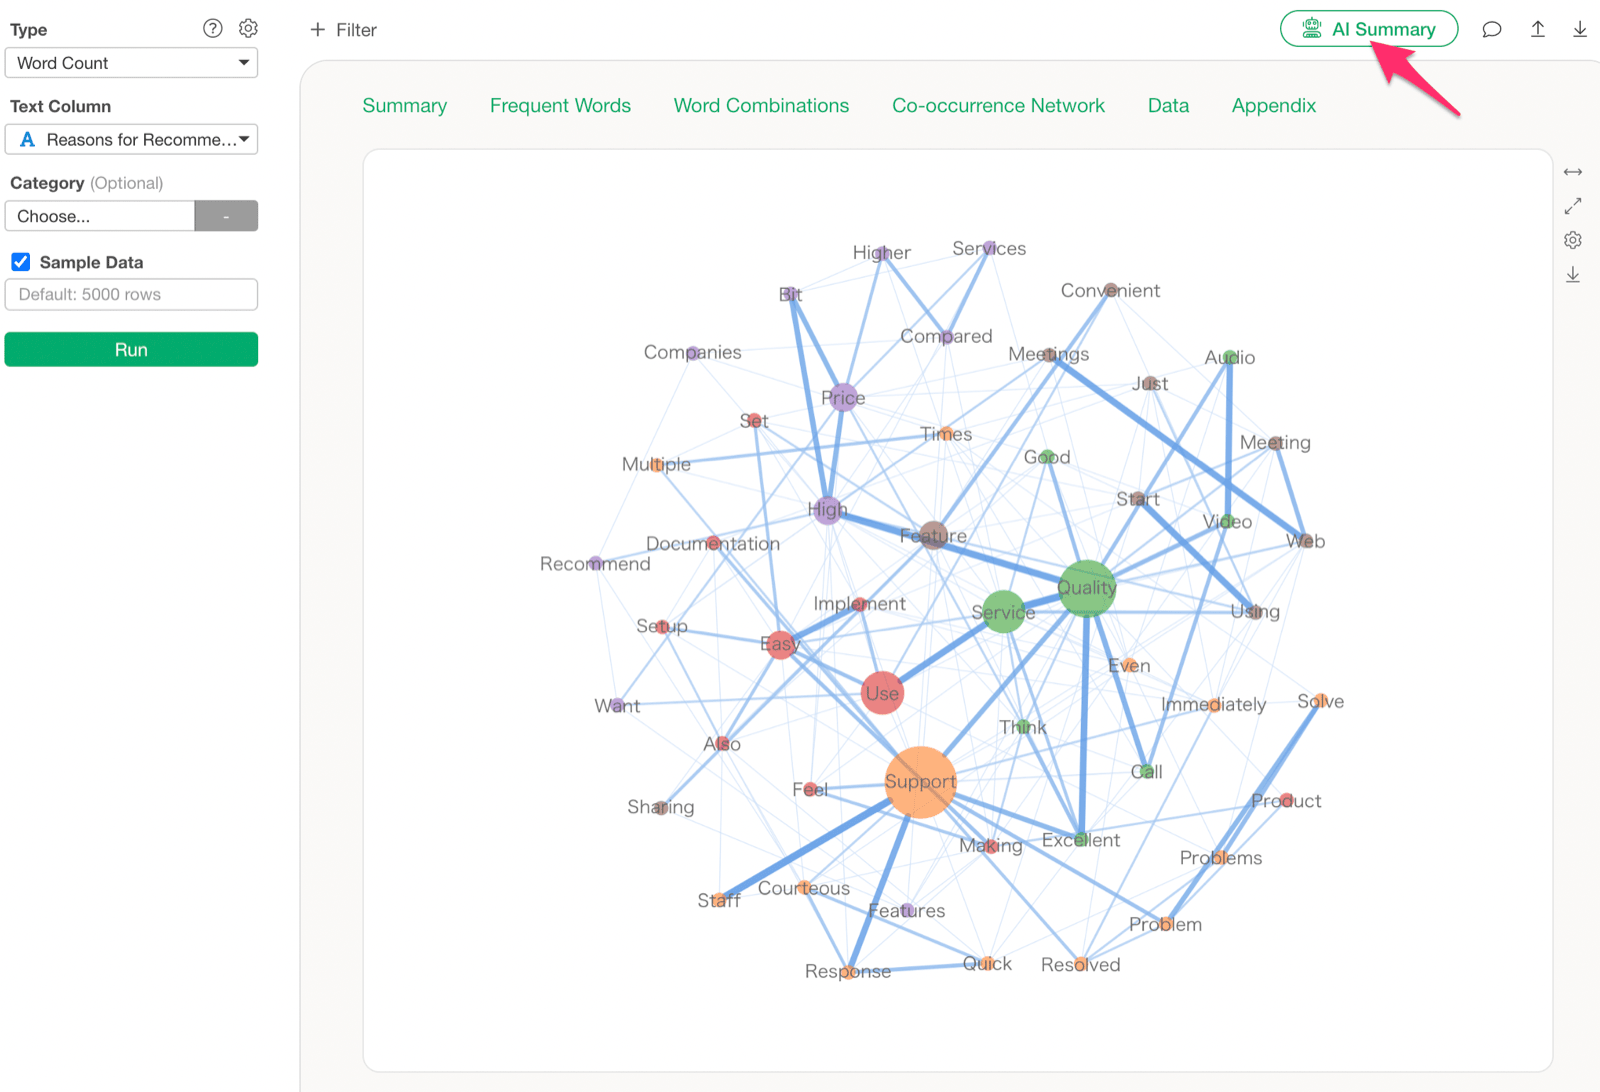
In “Word Count,” you can analyze what kind of word groups exist using charts like co-occurrence networks.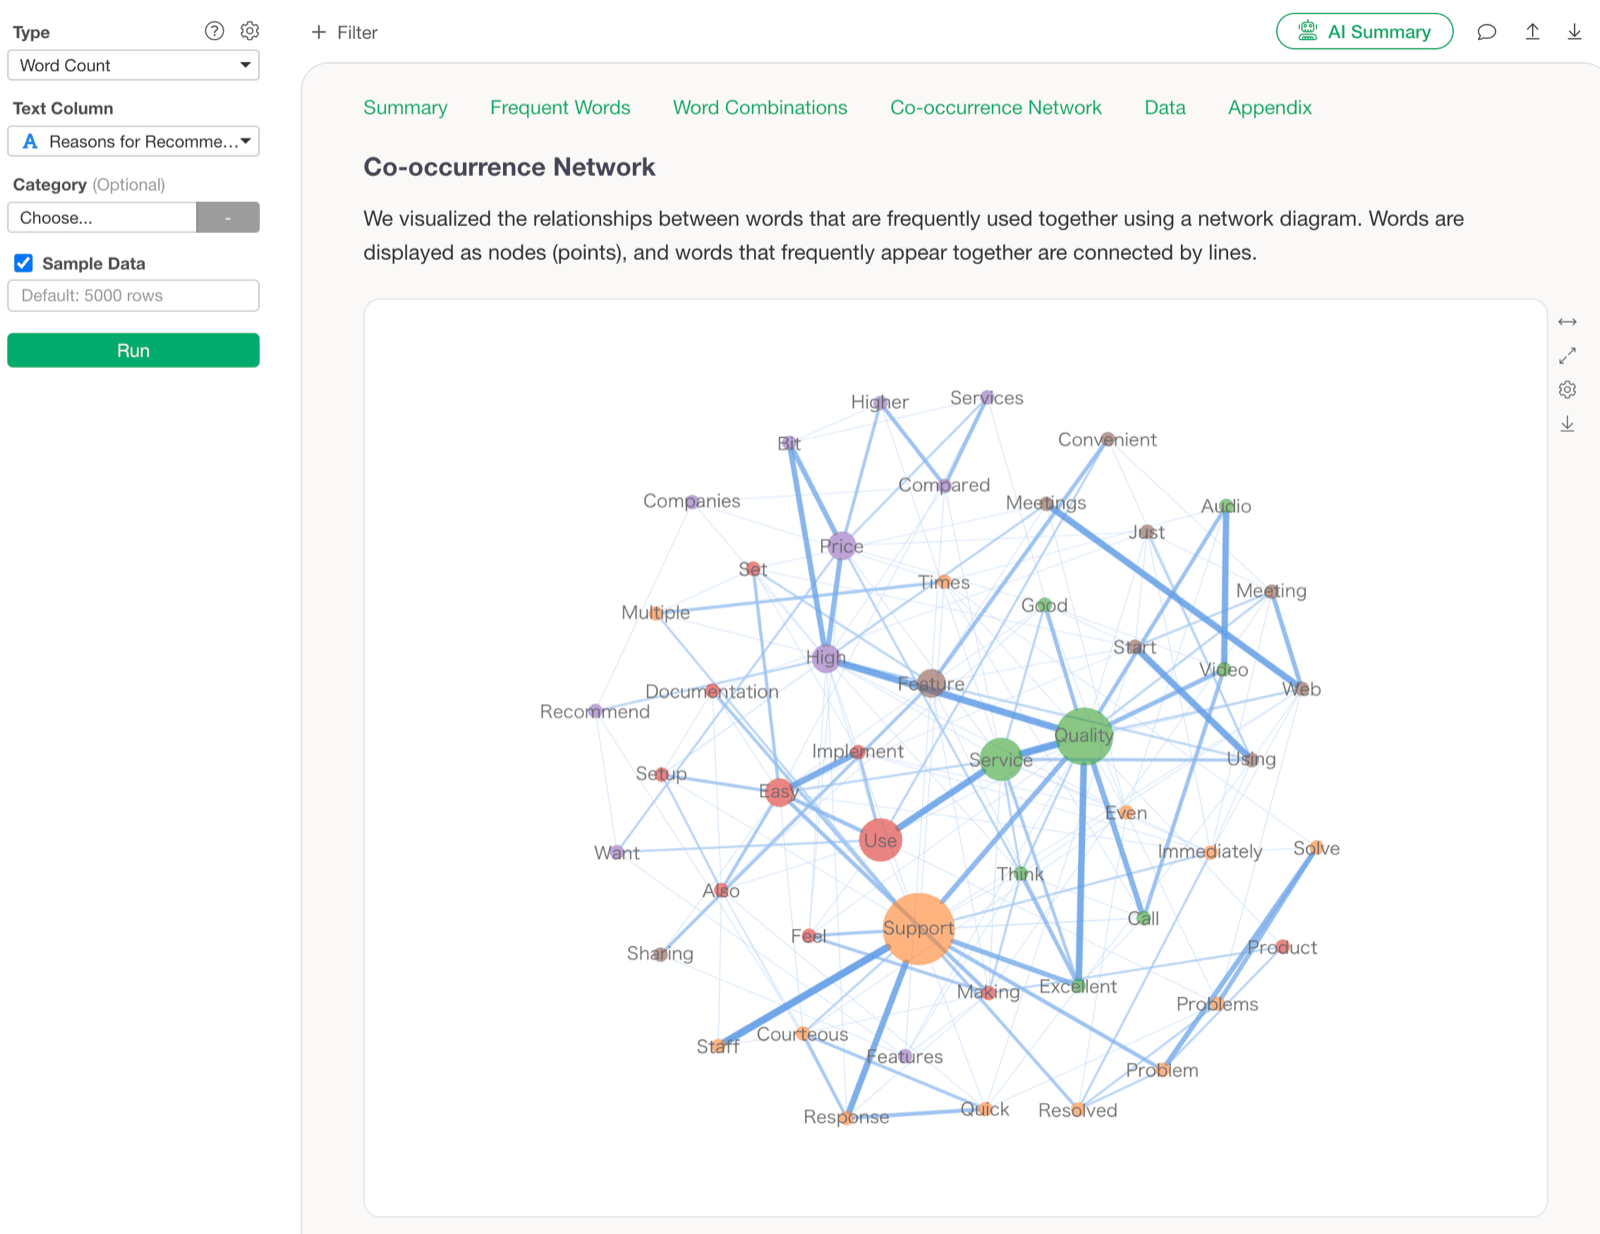
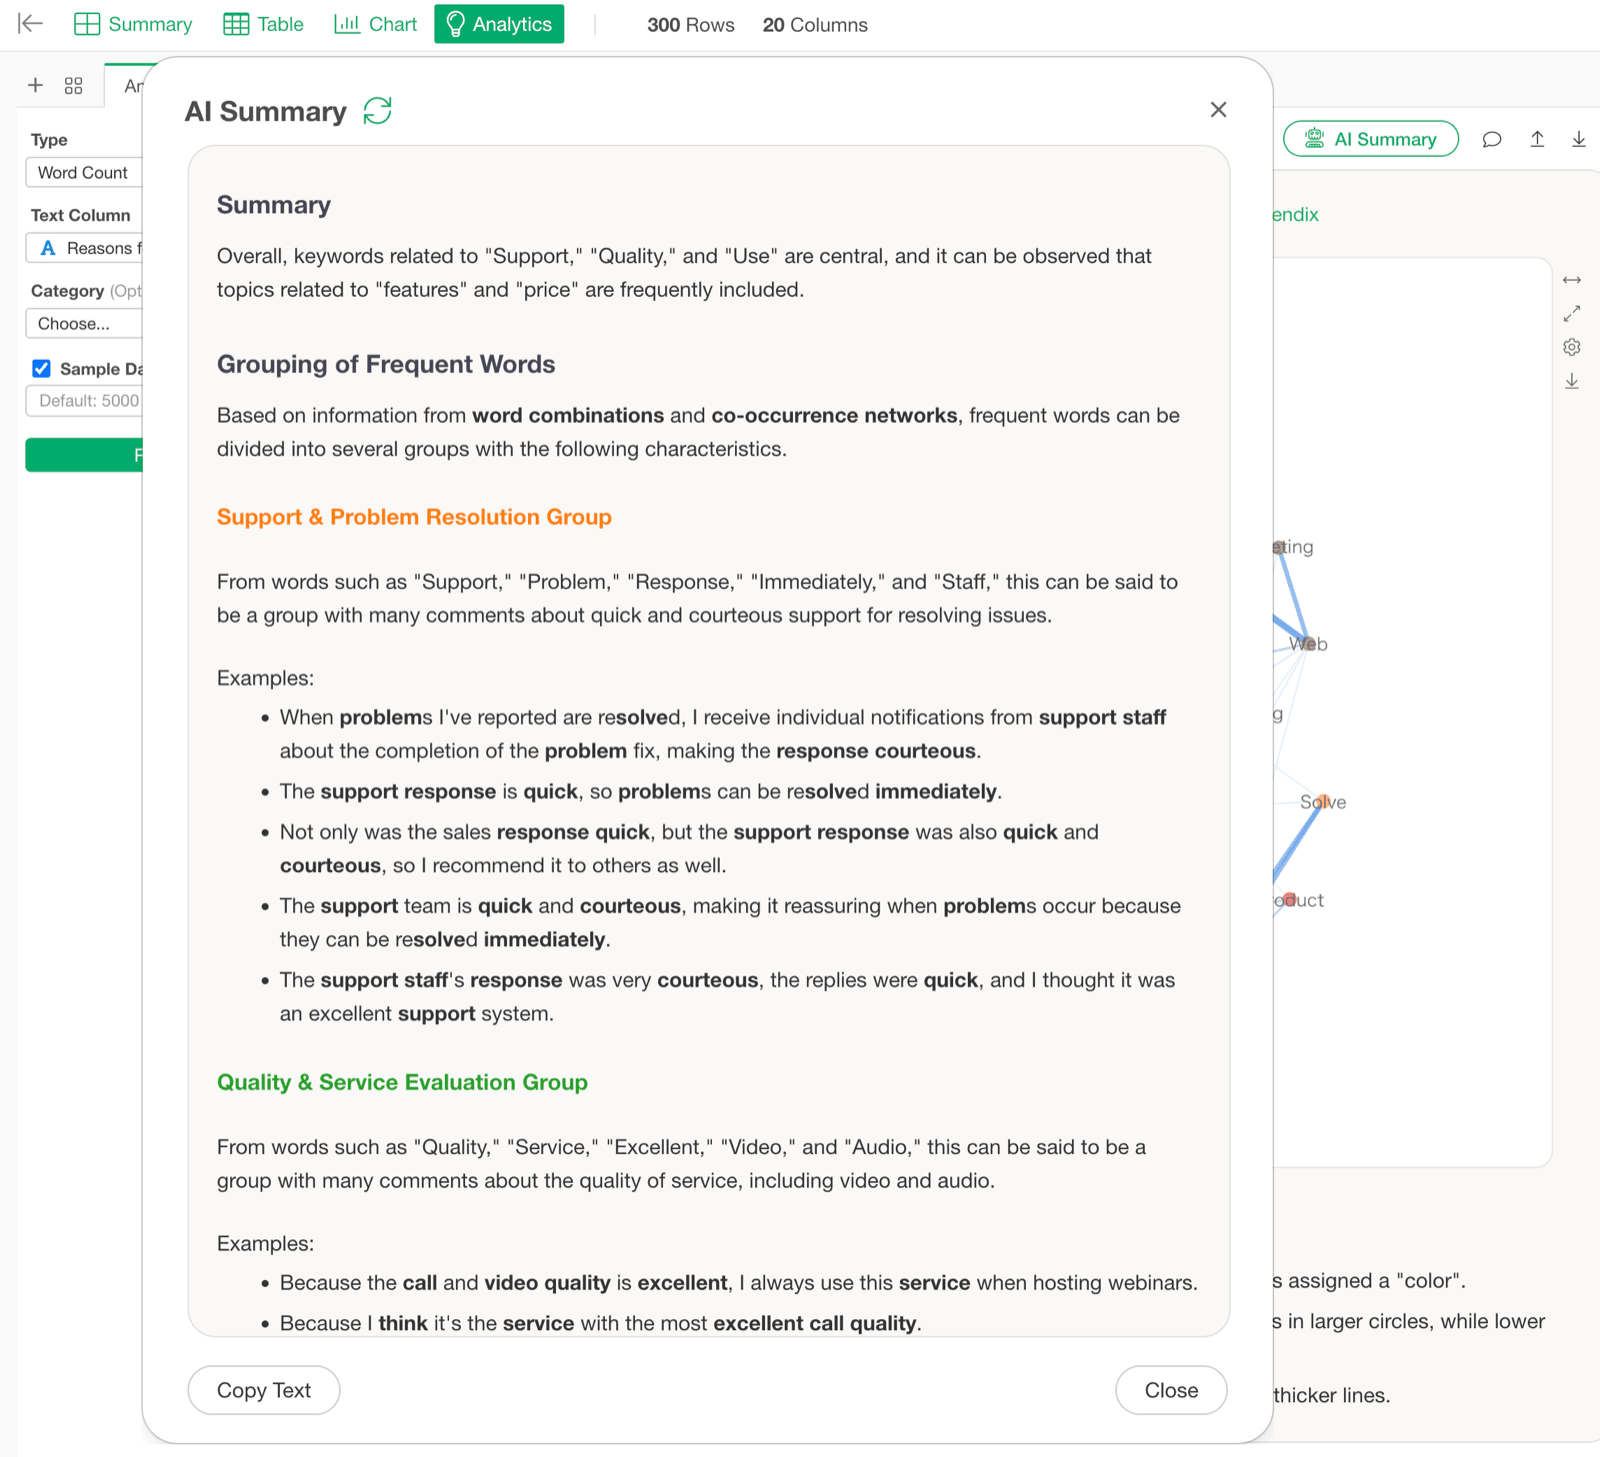
K-Means Clustering
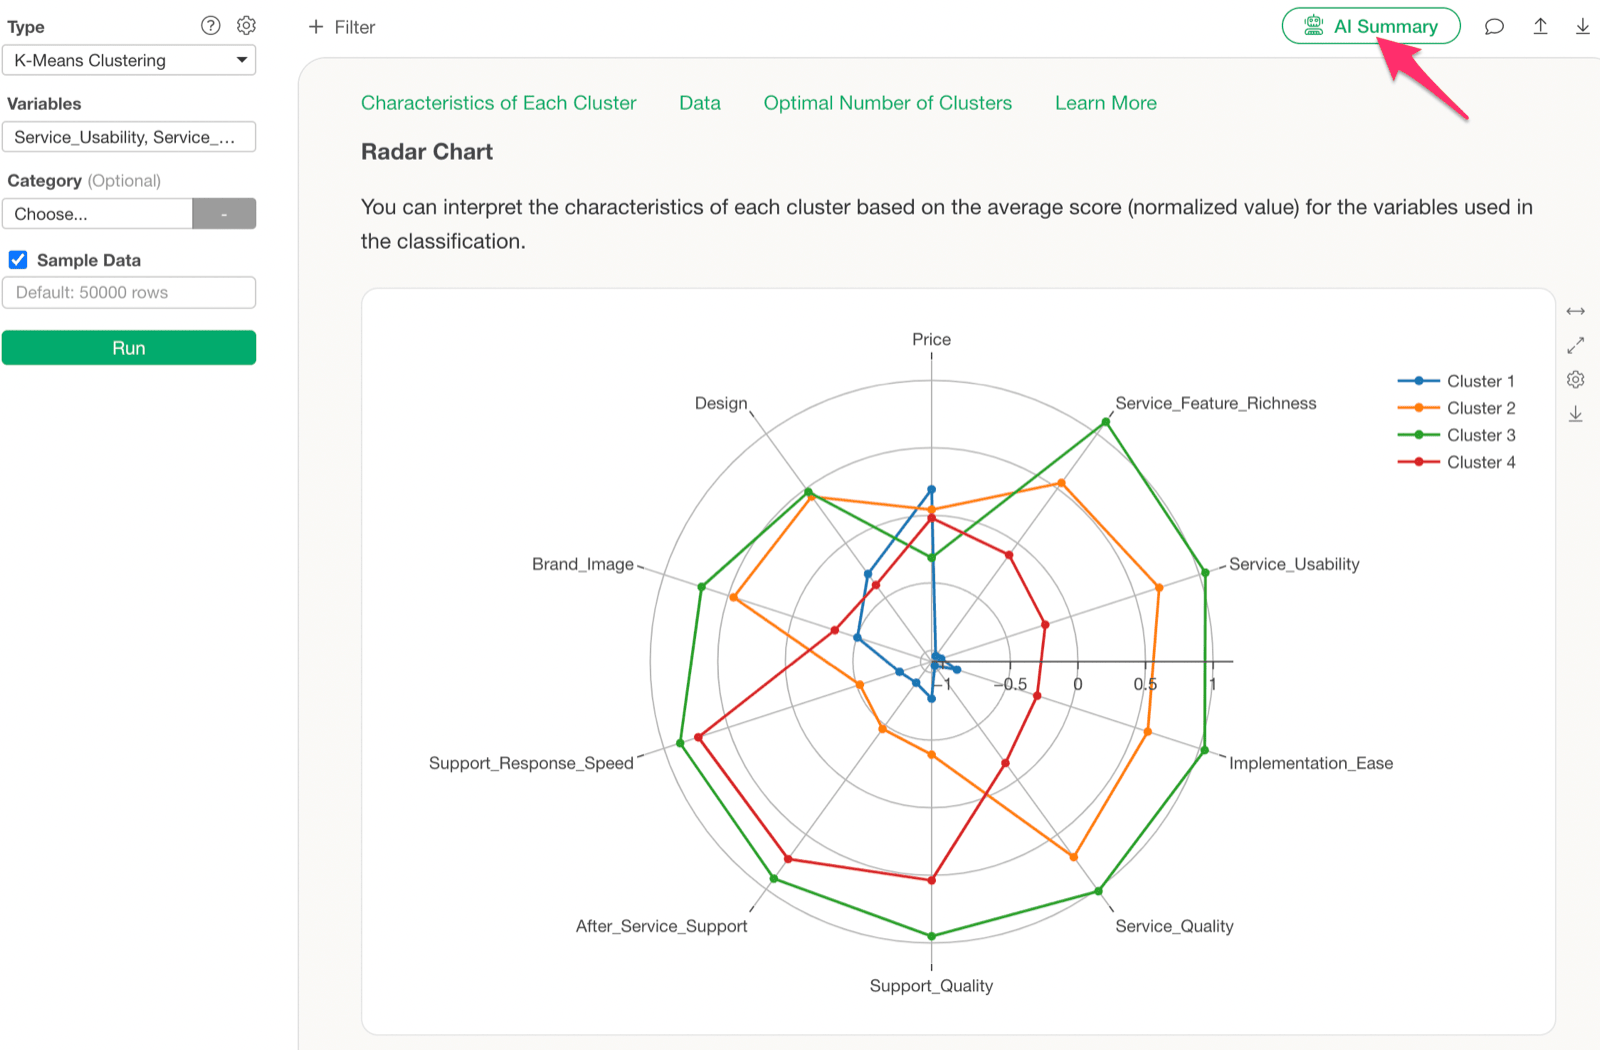
In K-Means Clustering, you can check the characteristics of each cluster using several charts such as radar charts and scatter plots (biplots). The following is a radar chart, which shows that Cluster 3 generally has high ratings, and Cluster 1 generally has low ratings. The Guided Analytics also provides detailed explanations on how to read the charts.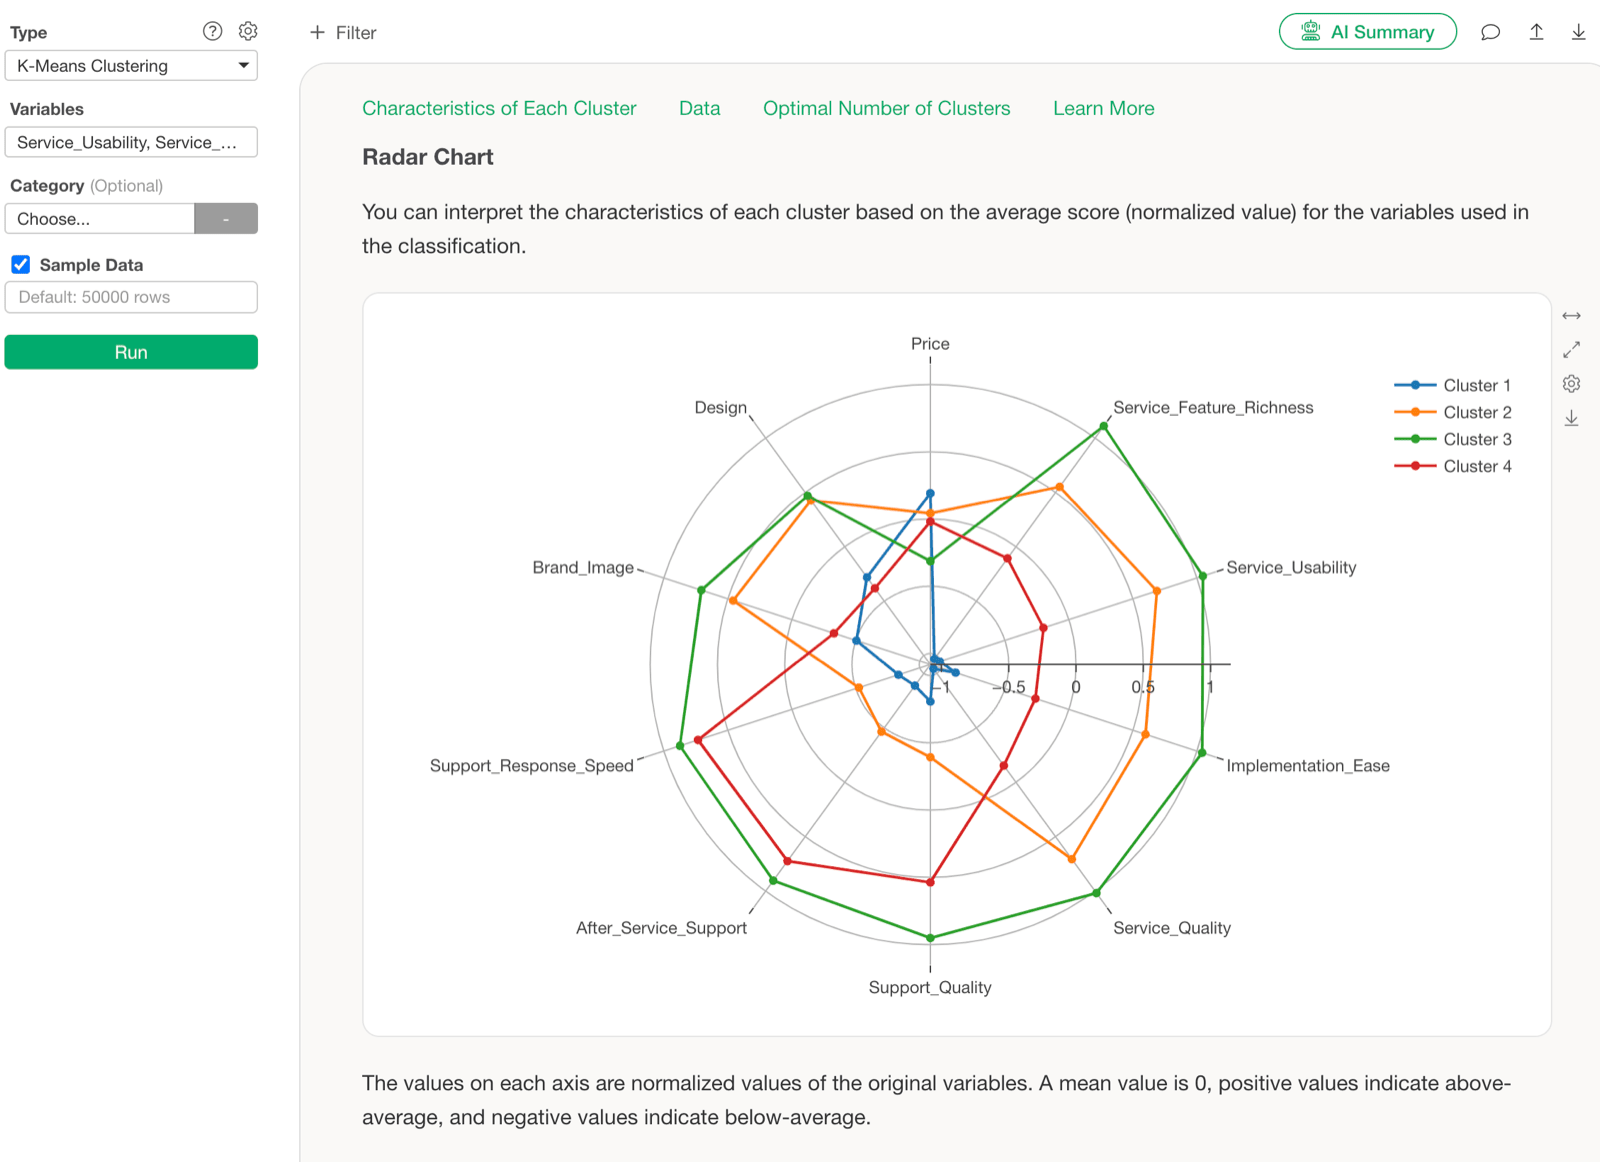
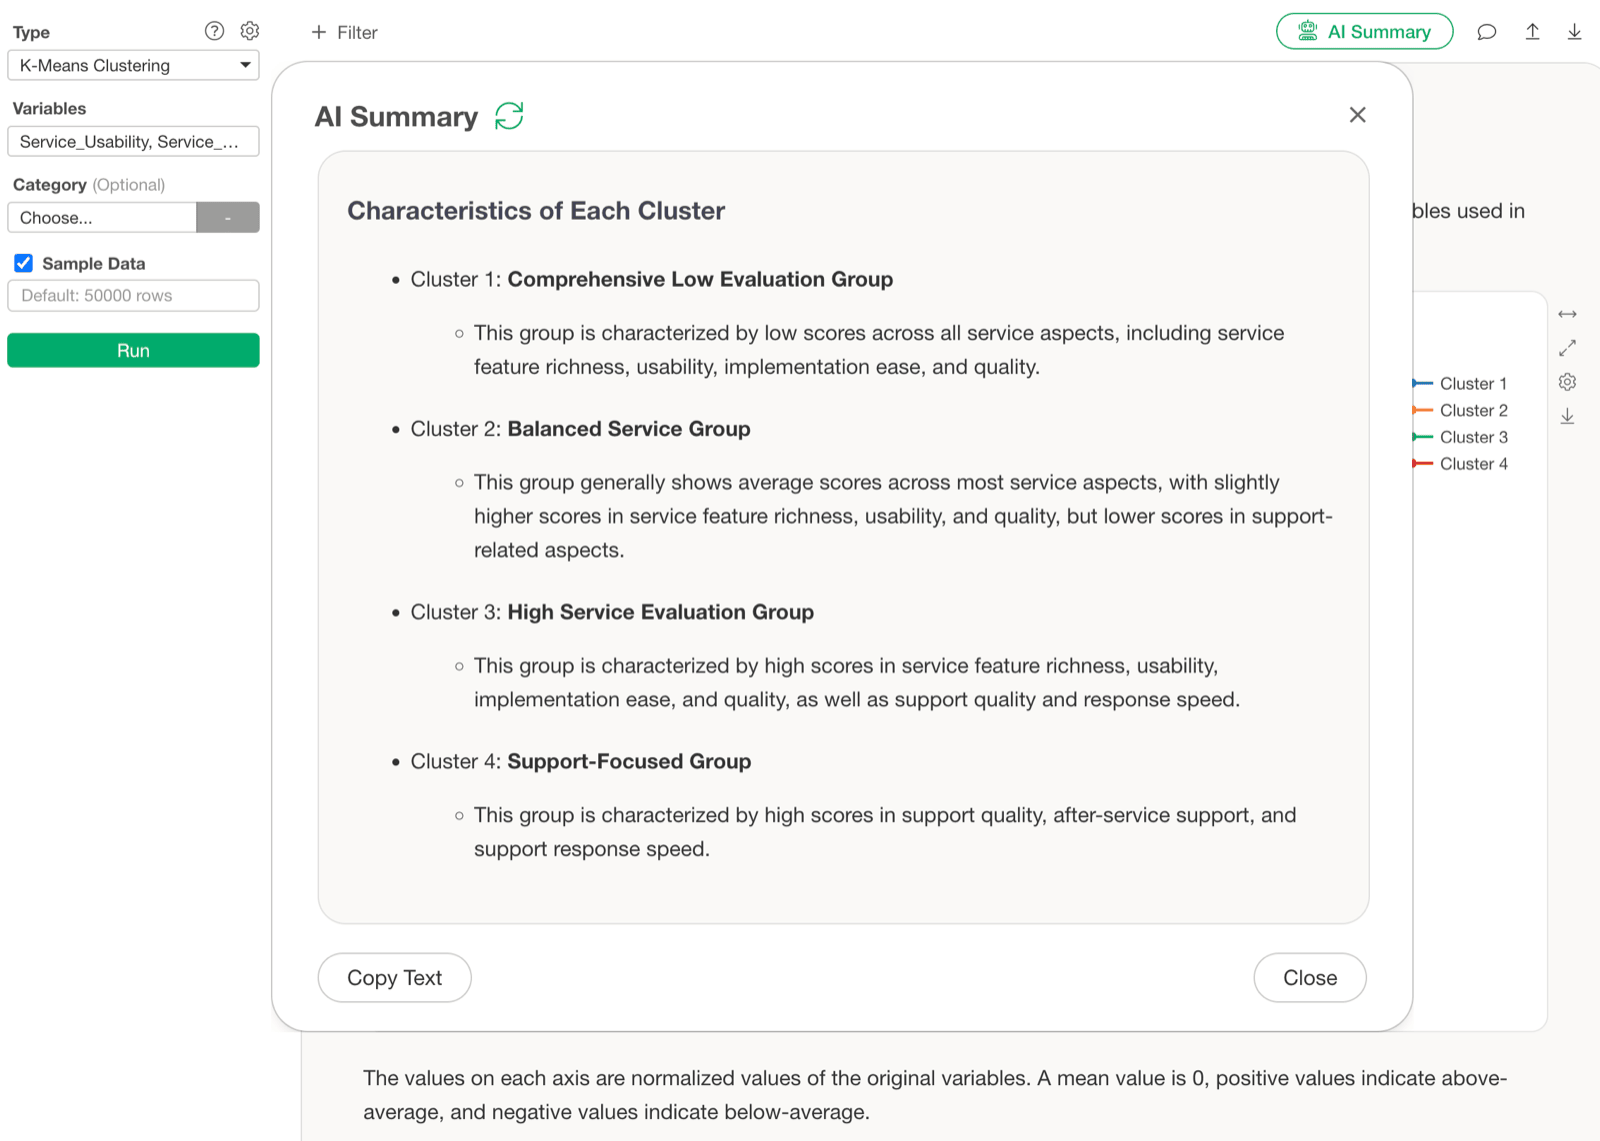
- Cluster 1: Comprehensive Low Evaluation Group
- Cluster 2: Balanced Service Group
- Cluster 3: High Service Evaluation Group
- Cluster 4: Support-Focused Group
Results for Other Analytics
Topic Model
For Topic Models, it summarizes the characteristics of each topic and explains them along with actual sentences.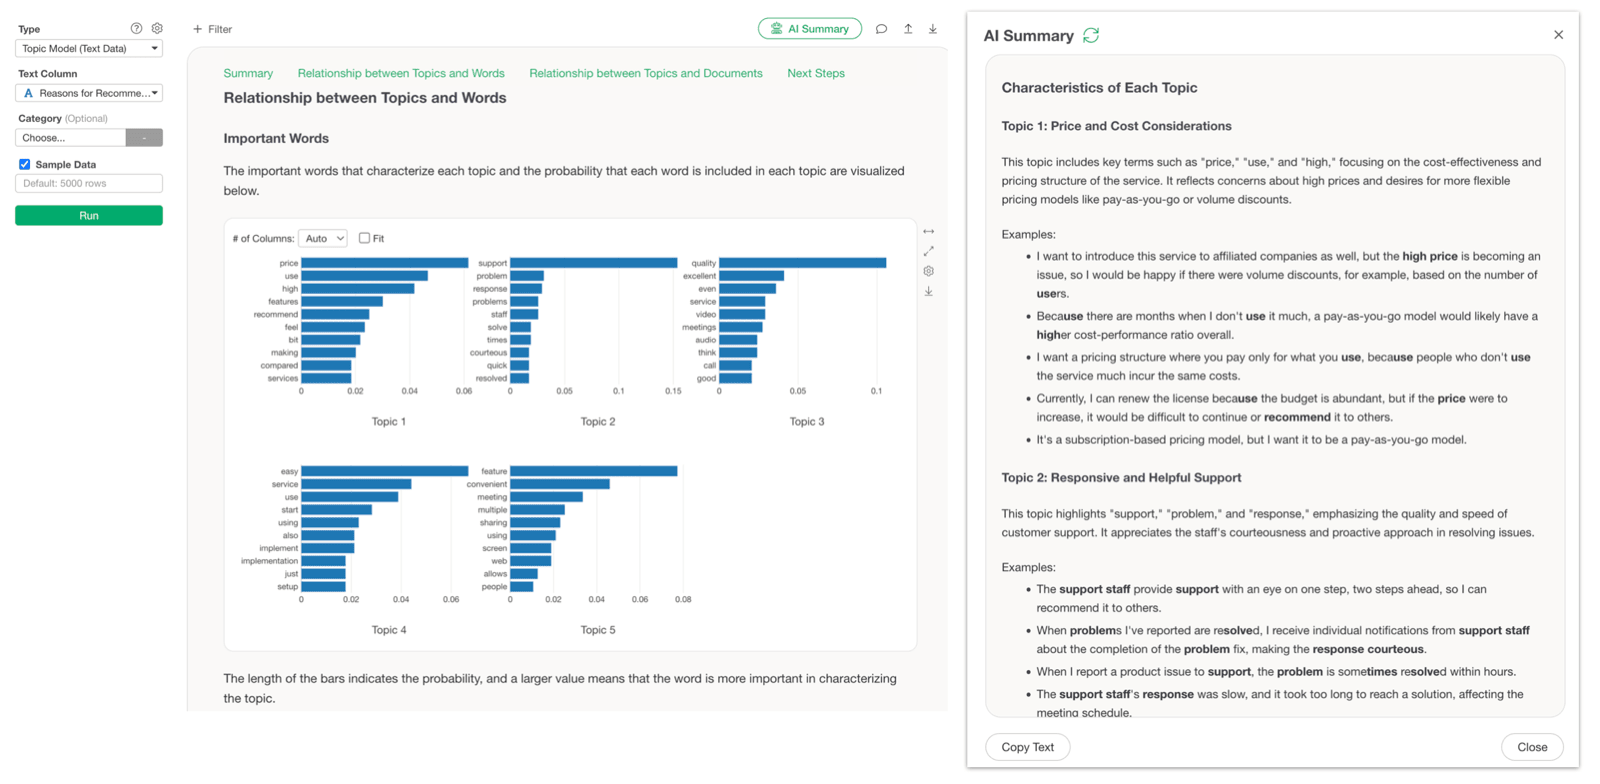
Factor Analysis
For Factor Analysis, it explains the characteristics of each factor based on factor loadings.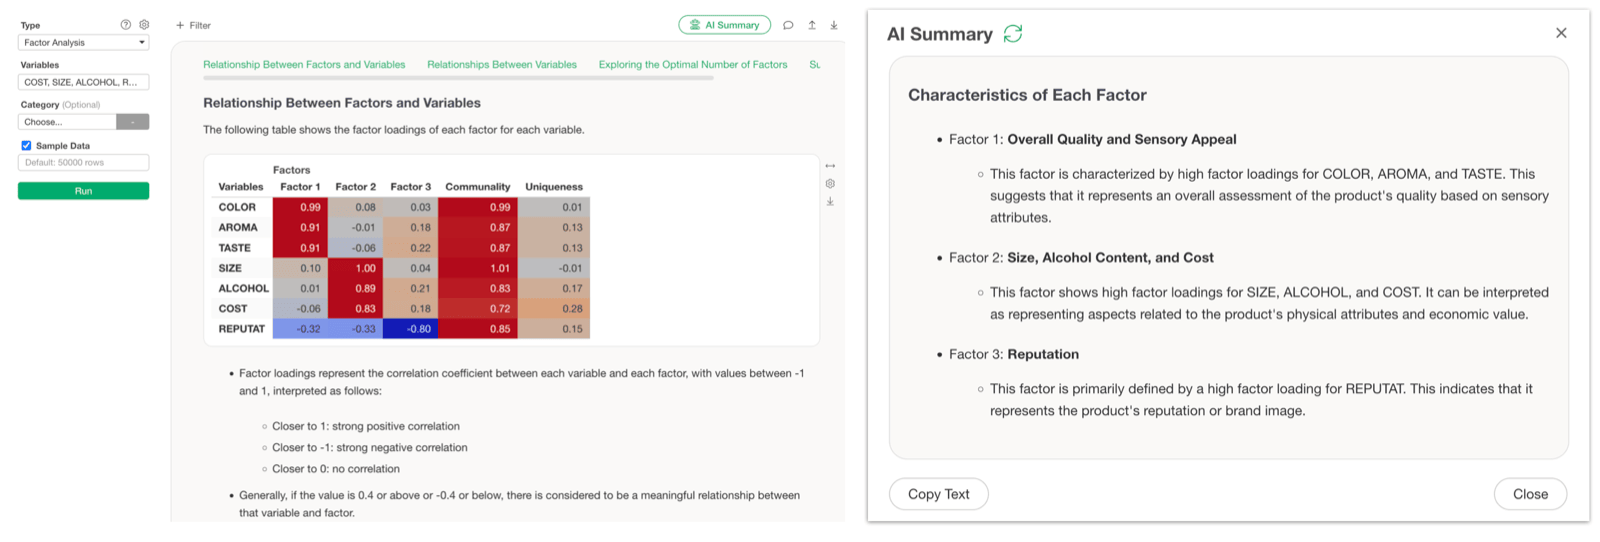
Correspondence Analysis
For Correspondence Analysis, it explains the relationships between variable values (categories) in text.