With Exploratory Page, you can tell Claude or another AI tool which data to use and what you want to see. The AI can create a dashboard, an analysis report, or slides that you can open in your browser. In this guide, you’ll use the Claude desktop app and the Sales Orders (Line Items) dataset to build a dashboard for monitoring orders.

Connect your AI tool to Exploratory

You can create an Exploratory Page from any AI tool connected to Server MCP: Claude, ChatGPT, Cursor and others. For connection instructions, see Add from an AI tool. This example starts in the Claude desktop app with the Exploratory connector already set up.

Create an order dashboard

In your request, name the dataset, explain what you want to see, and include links to any designs you want Claude to use as references.
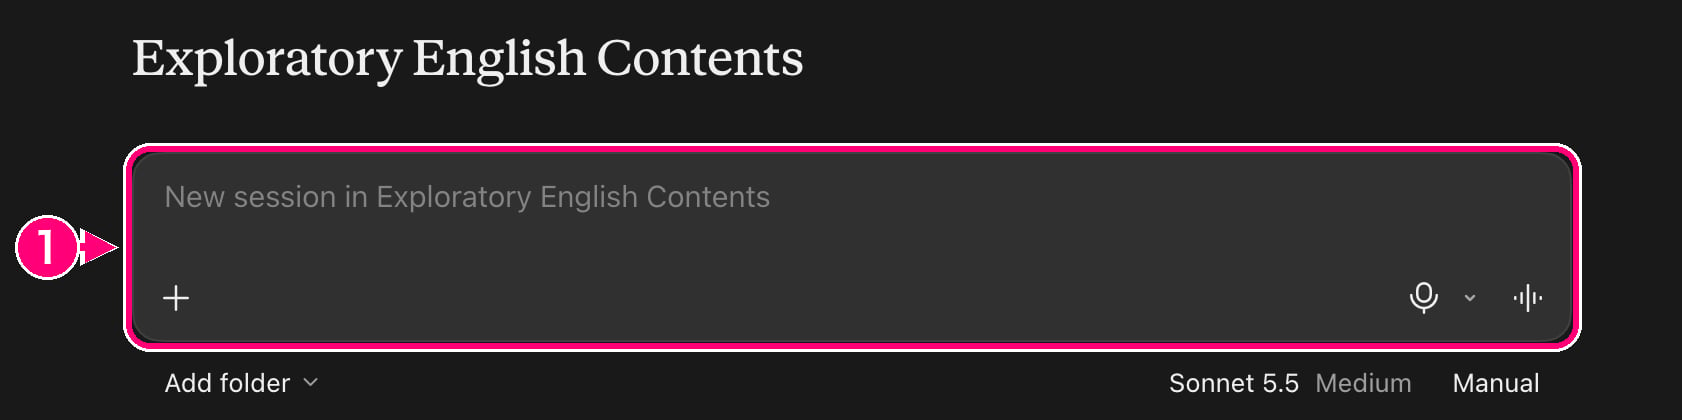
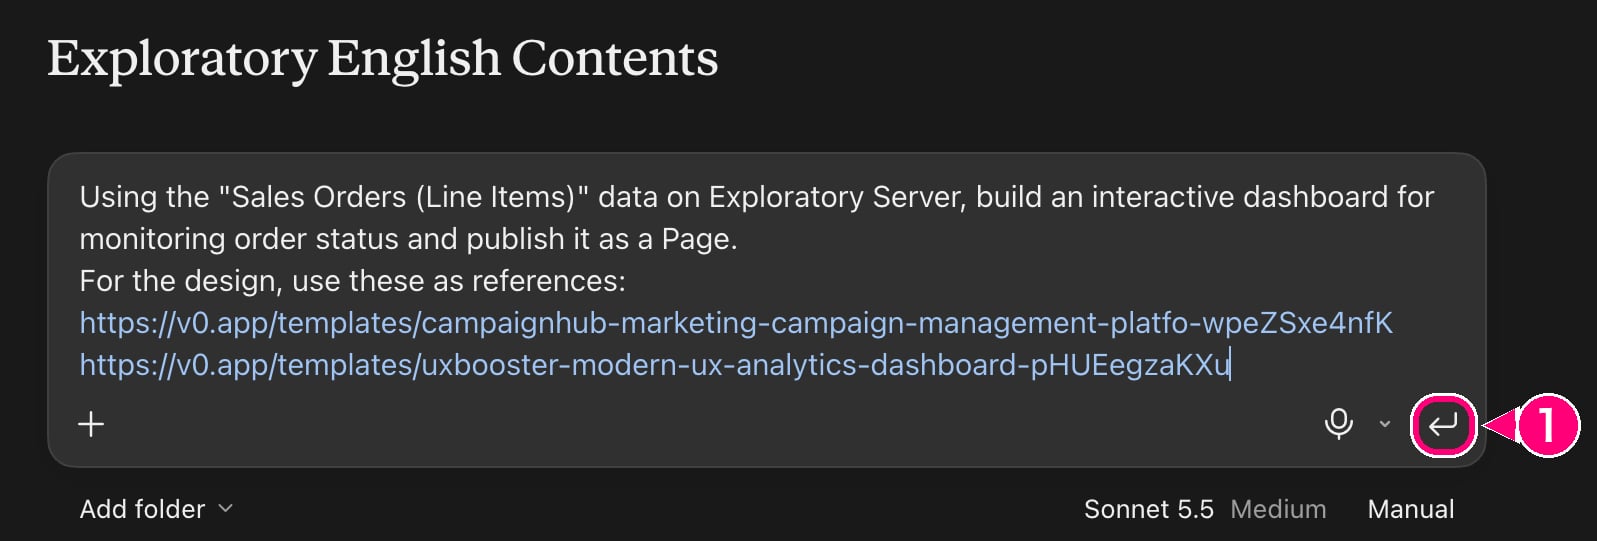
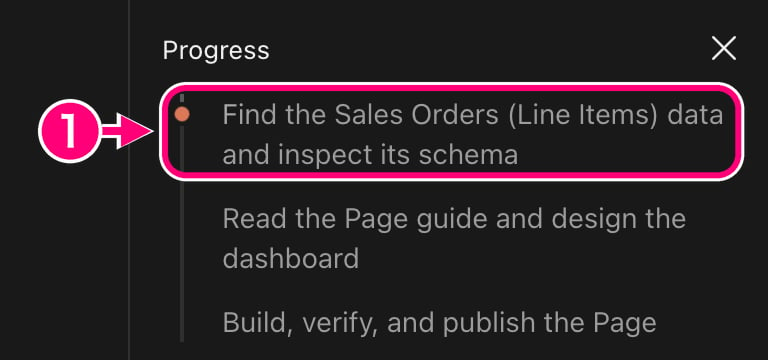
❶ Paste the request above into the New session input box. New session input box in Claude ❶ Click the send arrow (↵) in the lower-right corner of the input box. Send arrow in the lower-right corner of the input box The first time Claude uses an Exploratory tool such as Get Data Schema or Publish a Page, it may ask for permission. Review the tool and the action before you approve it. ❶ In the Progress panel on the right, check the first step, “Find the Sales Orders (Line Items) data and inspect its schema.” Sales Orders schema check in the Progress panel

Allow Claude to check your Page in Chrome

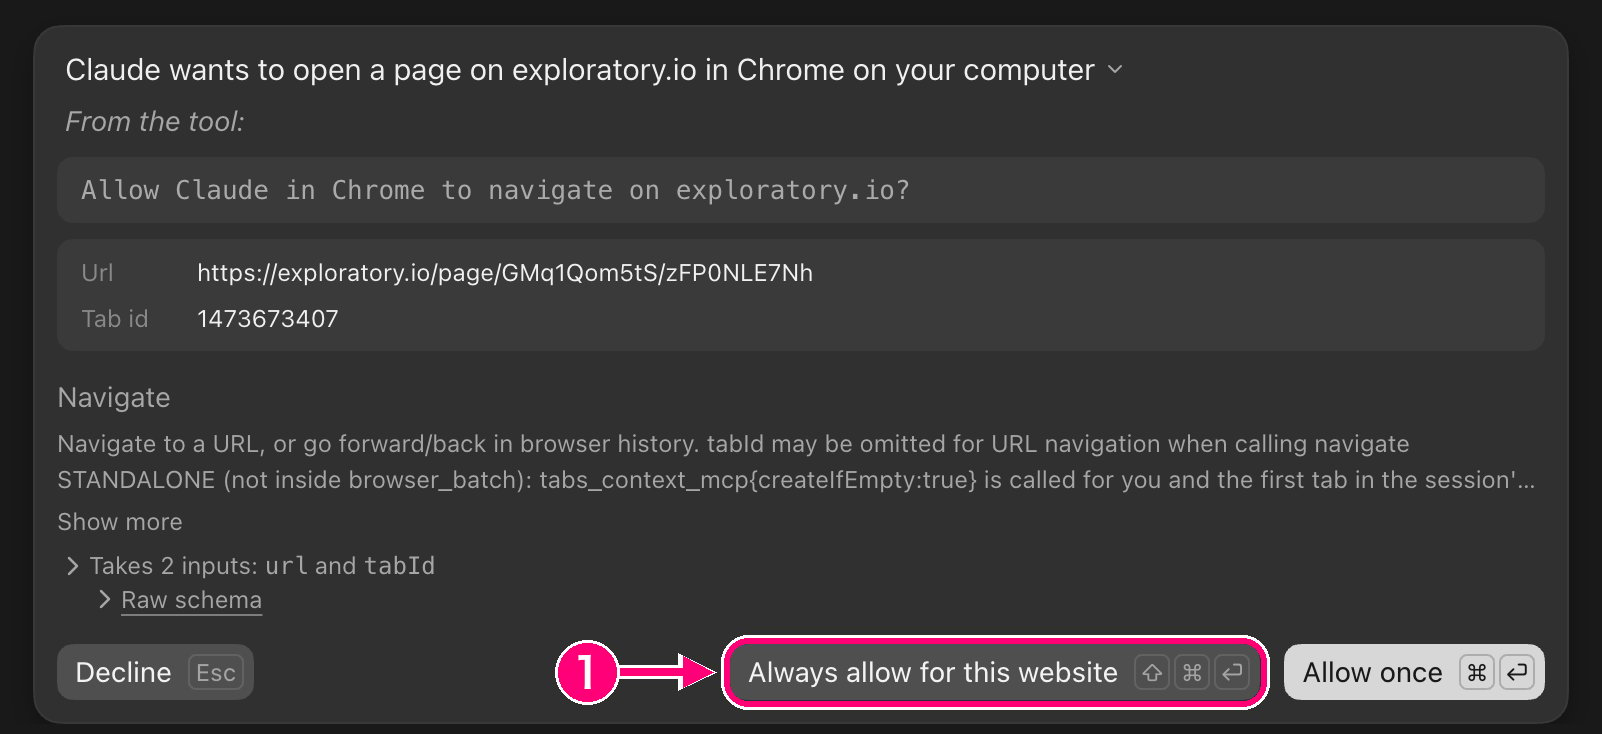
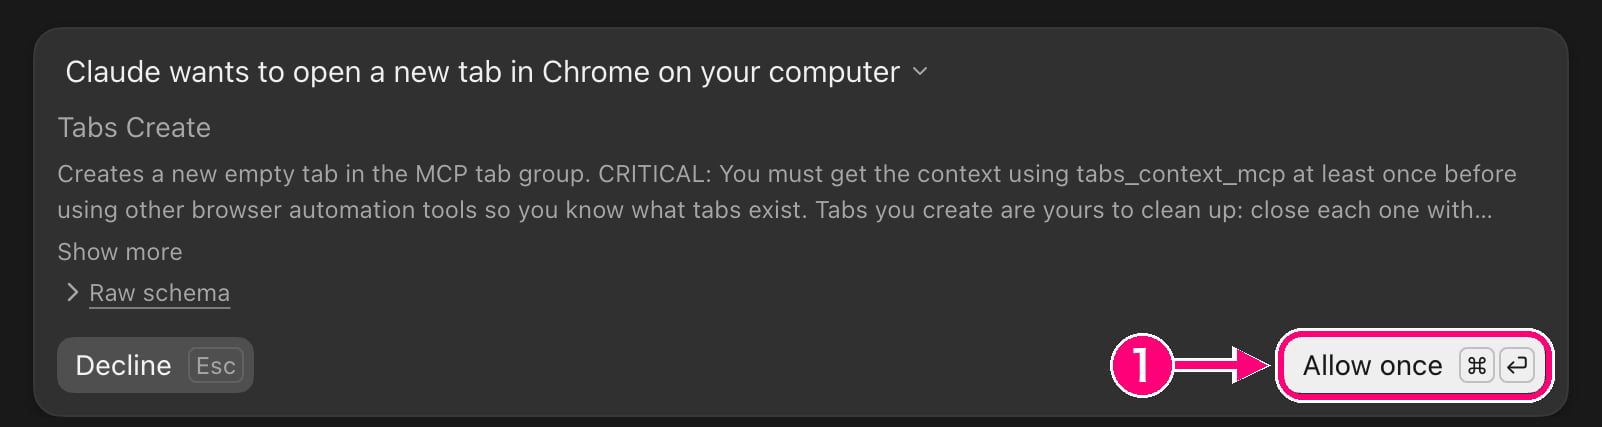
If you have the Claude in Chrome extension, Claude may open the finished Page in Chrome to check it. ❶ If Claude asks to open the Page in Chrome, check the URL and select Always allow for this website. Permission to open the Page in Chrome In our test, after we selected Always allow for this website, Claude didn’t ask again for permission to navigate to the same site in the same chat. It did ask again when it needed to open a new tab (below). In a new chat, Claude may ask again the first time it opens a page on that site. ❶ If Claude asks to open a new Chrome tab (Tabs Create), select Allow once each time the prompt appears. This is the only option that grants permission. Permission to open a new Chrome tab
Open your Page

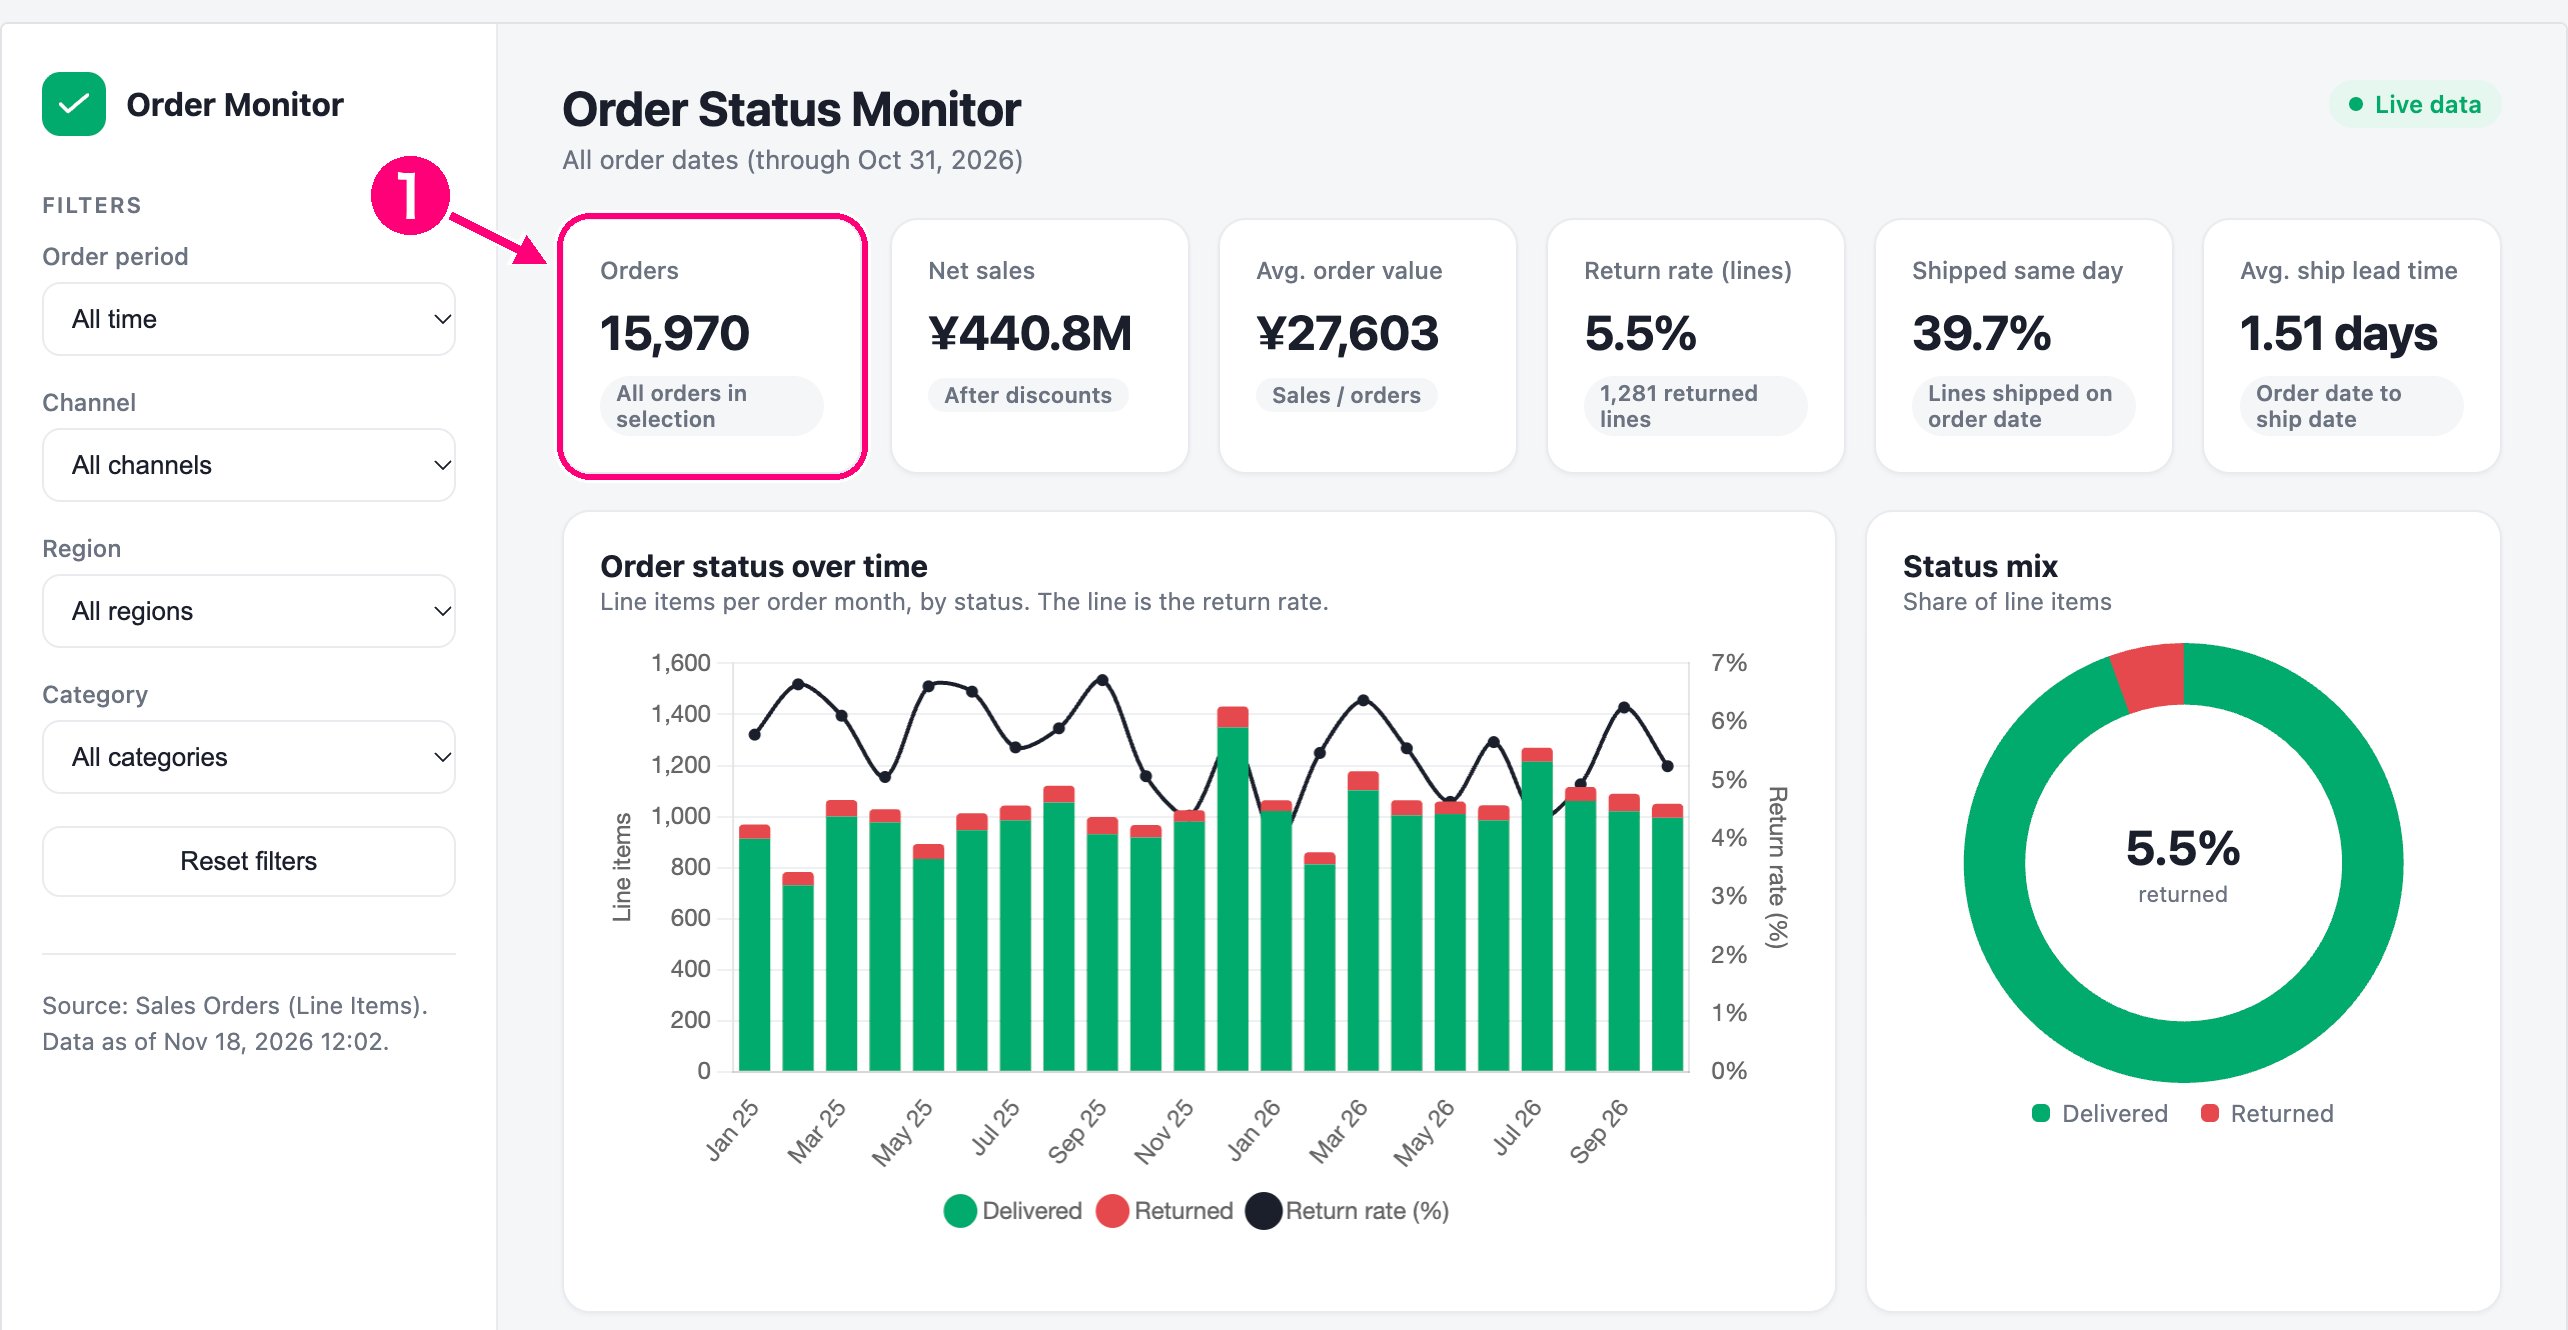
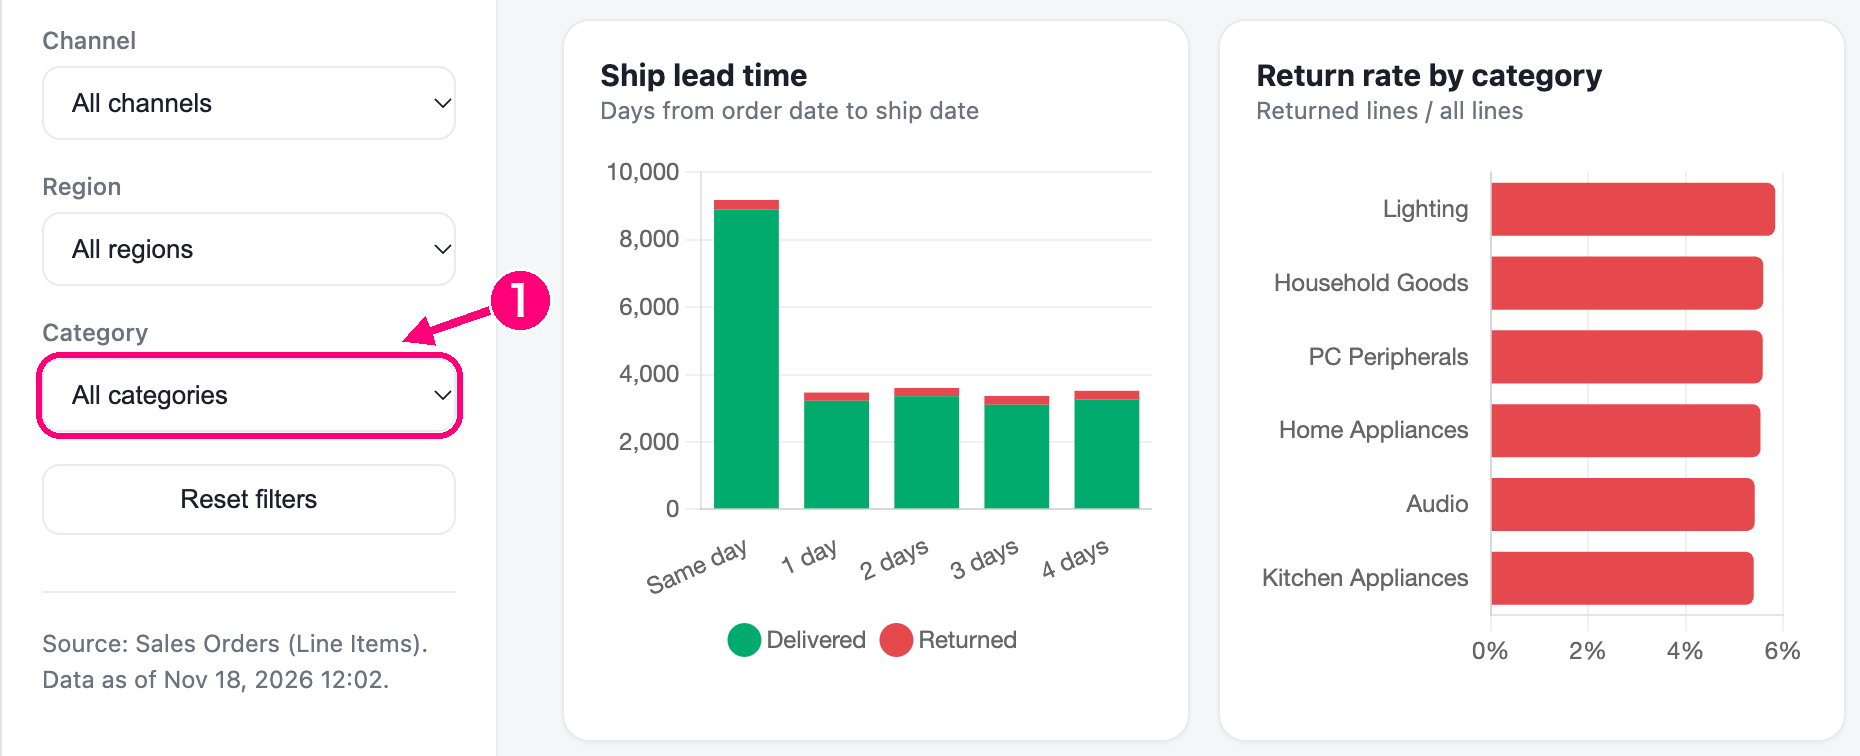
❶ In Claude’s final reply, click the Page URL to open your dashboard. Page URL in Claude’s final reply ❶ In Order Status Monitor, check the Orders card to see how many orders were placed in the selected period. Orders card in Order Status Monitor ❶ On the left, open the Category filter, which displays All categories. Select a category to see orders for that category. Category filter showing All categories Open the dashboard made in these steps You can also create analysis reports and slides. For the requests and the results, see Examples.